Source: This essay is a modified excerpt from Openstax Statistics.
An important characteristic of any set of data is the variation in the data. In some data sets, the data values are concentrated closely near the mean; in other data sets, the data values are more widely spread out from the mean. The most common measure of variation, or spread, is the standard deviation. The standard deviation is a number that measures how far data values are from their mean.
The standard deviation
- provides a numerical measure of the overall amount of variation in a data set, and
- can be used to determine whether a particular data value is close to or far from the mean.
The standard deviation provides a measure of the overall variation in a data set
The standard deviation is always positive or zero. The standard deviation is small when the data are all concentrated close to the mean, exhibiting little variation or spread. The standard deviation is larger when the data values are more spread out from the mean, exhibiting more variation.
Suppose that we are studying the amount of time customers wait in line at the checkout at supermarket A and supermarket B. the average wait time at both supermarkets is five minutes. At supermarket A, the standard deviation for the wait time is two minutes; at supermarket B the standard deviation for the wait time is four minutes.
Because supermarket B has a higher standard deviation, we know that there is more variation in the wait times at supermarket B. Overall, wait times at supermarket B are more spread out from the average; wait times at supermarket A are more concentrated near the average.
The standard deviation can be used to determine whether a data value is close to or far from the mean.
Suppose that Rosa and Binh both shop at supermarket A. Rosa waits at the checkout counter for seven minutes and Binh waits for one minute. At supermarket A, the mean waiting time is five minutes and the standard deviation is two minutes. The standard deviation can be used to determine whether a data value is close to or far from the mean.
Rosa waits for seven minutes:
- Seven is two minutes longer than the average of five; two minutes is equal to one standard deviation.
- Rosa’s wait time of seven minutes is two minutes longer than the average of five minutes.
- Rosa’s wait time of seven minutes is one standard deviation above the average of five minutes.
- A data value that is less than 1 standard deviations from the average is considered very common, so Rosa’s wait is only a bit longer than average and is not unusual.
Binh waits for one minute.
- One is four minutes less than the average of five; four minutes is equal to two standard deviations.
- Binh’s wait time of one minute is four minutes less than the average of five minutes.
- Binh’s wait time of one minute is two standard deviations below the average of five minutes.
- A data value that is more than 2 standard deviations from the average is considered unusual, so Binh’s wait is unusually short.
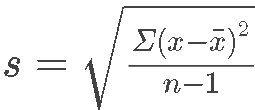
The symbol x̄ is the sample mean and the Greek symbol μ is the population mean. The reason we distinguish between them is that we are always interested in knowing the true population mean (μ), but it is usually too expensive to measure everyone in a population so we have to take a sample and then we use the sample mean (x̄) to estimate the population mean (μ). The formula for the sample standard deviation (s) has to be slightly different than the formula for the population standard deviation (σ) because there is more uncertainty about the sample mean (s) and so we reduce the sample size (n) by one to adjust for the uncertainty as you can see in the formulas below.
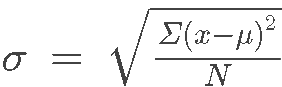
The population standard deviation (σ) is the total squared deviation from the population mean (μ) divided by the total population size (N):
The sample standard deviation (s) is the total squared deviation from the population mean (x̄) divided by the sample size (n), and the sample size is reduced by one (n-1) because of there is more uncertainty in this equation since it is just a sample and not the population :