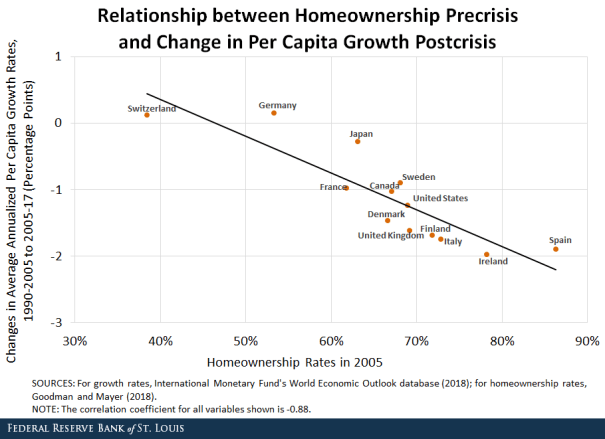
The St. Louis Fed produced the above graph showing that nations with higher homeownership rates were hit harder by the 2007 financial crisis and are still dealing with greater aftereffects today. Nations with the most rental properties like Switzerland and Germany have grown faster after the financial crisis than they did before. Nations with the highest homeownership like Ireland and Spain saw the biggest drop off in economic growth.
One of the most interesting things about this graph is the dramatically different homeownership patterns in different rich nations.
National Homeownership Rates (Percent)
|
1990 |
2000 |
2005 |
2010 |
2015 |
|
| Canada |
62.6 |
65.8 |
67.1 |
69.0 |
67.0 |
| Denmark |
54.5 |
51.0 |
66.6 |
66.6 |
62.7 |
| Finland |
67.0 |
61.0 |
71.8 |
74.3 |
72.7 |
| France |
54.4 |
54.8 |
61.8 |
62.0 |
64.1 |
| Germany |
37.3 |
41.3 |
53.3 |
53.2 |
51.9 |
| Ireland |
80.0 |
78.9 |
78.2 |
73.3 |
70.0 |
| Italy |
64.2 |
69.0 |
72.8 |
72.6 |
72.9 |
| Japan |
63.2 |
64.9 |
63.1 |
62.4 |
64.9 |
| Spain |
77.8 |
82.0 |
86.3 |
79.8 |
78.2 |
| Sweden |
41.0 |
67.0 |
68.1 |
70.8 |
70.6 |
| Switzerland |
31.3 |
34.6 |
38.4 |
44.4 |
51.3 |
| United Kingdom |
65.8 |
69.1 |
69.2 |
65.7 |
63.5 |
| United States |
63.9 |
66.8 |
68.9 |
66.9 |
63.7 |
| Median |
63.2 |
65.8 |
68.1 |
66.9 |
64.9 |
In Switzerland in 1990, only 31% of households owned their own home whereas in Ireland it was at 80%! Spain eventually reached 86% homeownership. In the 1970s and 1980s, the American home building and financing industries marketed the idea that owning a home is the American dream, and the US achieved above average homeownership rates. But in the aftermath of the financial crisis, American homeownership rates have been below the median for rich nations, so is it time to redefine the American dream to reflect the reality of declining home ownership?


Leave a Comment