Drinking culture in Central America is the opposite of what you see in the US on Cinco de Mayo

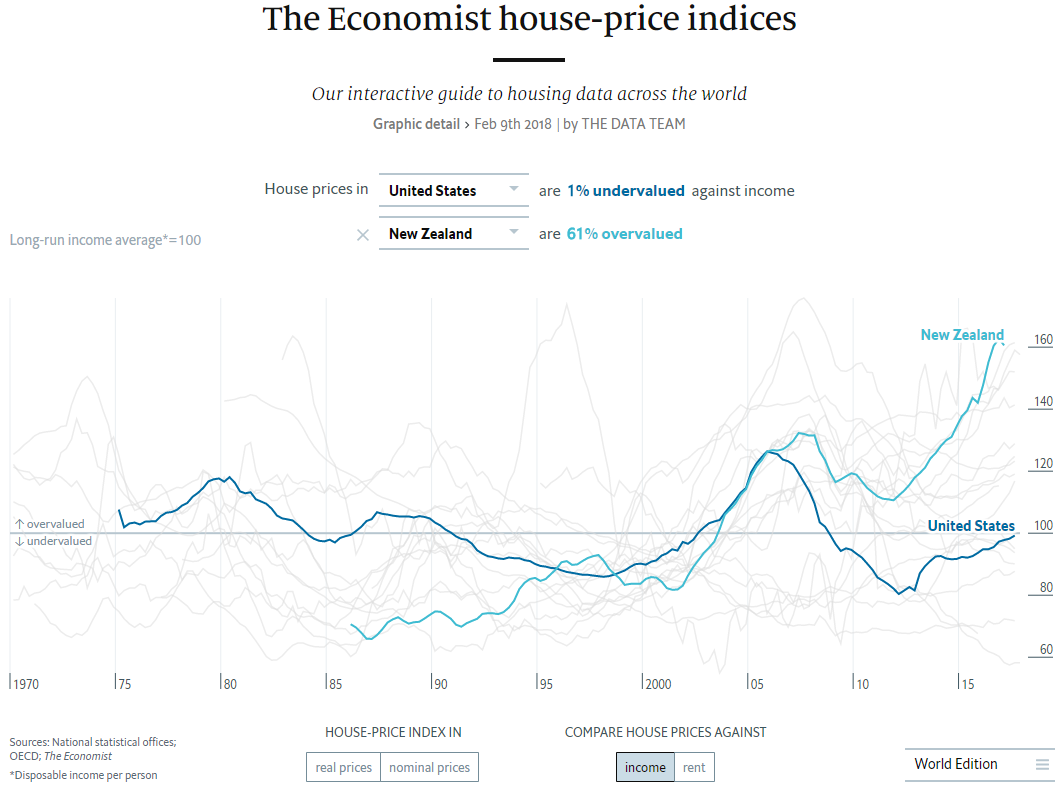
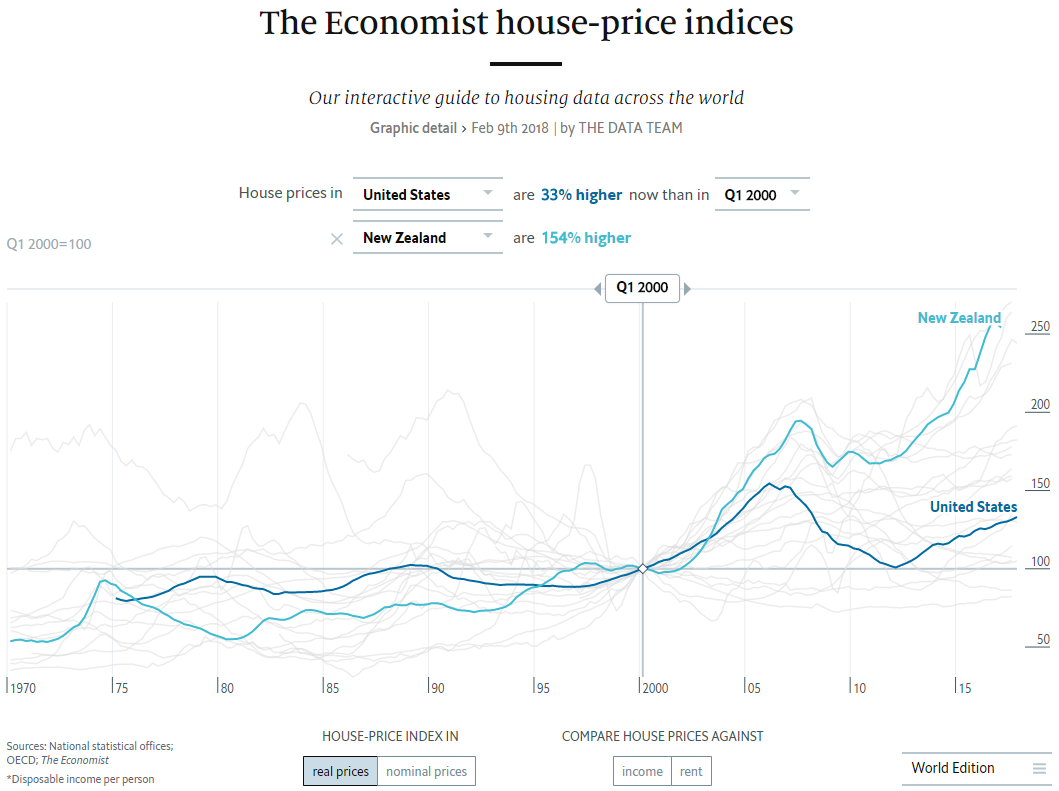
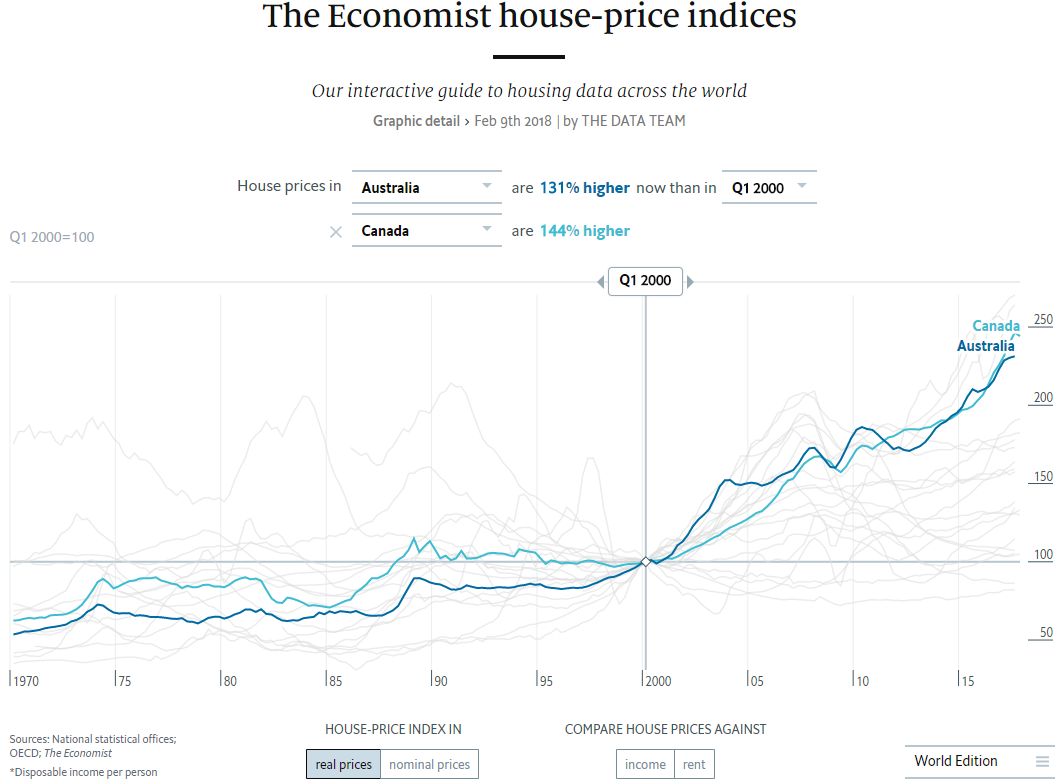
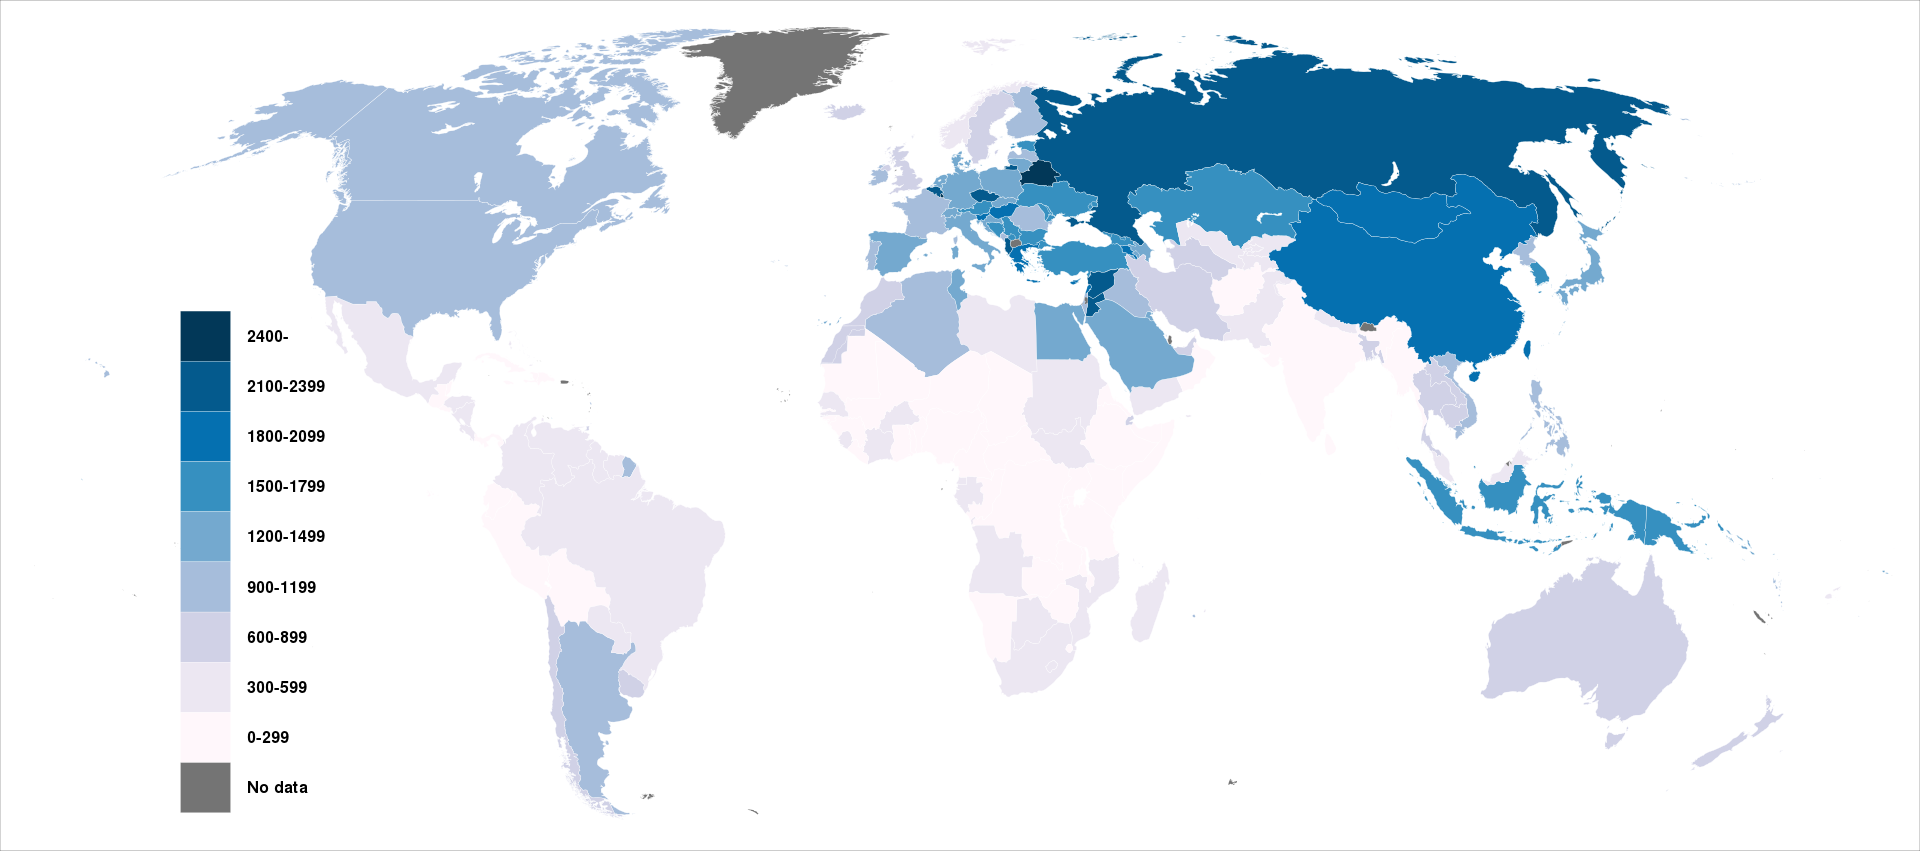
I spent last fall in Guatemala, so I was surprised to discover that Guatemala has about the lowest per-capita alcohol consumption of any predominantly Christian nation. Latin America actually drinks less than the rest of Western Civilization and outside of the famously alcohol-averse Muslim countries, most of Guatemala’s competition for lowest consumption are its Latin-American neighbors in Central America (plus Congo and a few island nations).

There are many Muslim nations with much lower alcohol consumption, but I was surprised that alcohol consumption is so low in Central America compared with the United States. Americans drink almost three times more on average than Central Americans in El Salvador. And the average alcohol consumption statistics for low-consumption nations are dramatically boosted by hard-drinking tourists. Even in hard drinking nations, about 80 percent of alcohol is consumed by less than 20 percent of the population. In low-consumption nations like Guatemala and the Muslim world, you can get ratios where more like 1% of the population (mostly foreigners) consume 90% of the alcohol. In any case, it is certain that most ordinary Guatemalans drink a lot less than the averages suggest.

Maybe I got the stereotype that Latin Americans drink a lot of alcohol from the images I’ve seen of American tourists who drink a lot of alcohol when they visit Latin America. Or perhaps I got the impression from the large number of Latin American alcohol brands in the US. Mexico is by far the world’s biggest exporter of Beer with 25% of the total market which mostly goes to the US, the world’s largest importer with 33% of the world market. Latin America also exports a large amount of hard liquor relative to their total exports and the US, again, is the world’s largest importer. The stereotype might also be reinforced by another part of Latin American culture that the US imported and reappropriated: Cinco De Mayo. This holiday is actually celebrated more in the US than in Mexico and is more of an American holiday than a Mexican one according to the book El Cinco de Mayo: An American Tradition. It is rarely celebrated in Mexico where it is staid patriotic event more like veteran’s day in the US. On this side of the border it is in the top five biggest drinking days of the entire calendar. Although Mexicans drink considerably less than Americans (27% less), they drink 89% more than Guatemalans, so their consumption is much closer to US levels than Guatemalan.

In retrospect, I shouldn’t have been surprised. I met MANY teetotalers in Guatemala and I don’t remember ever seeing any locals who seemed drunk. 36% of Guatemalan adults have never had alcohol in their lives and almost 60% had no alcohol in the past 12 months.  There were also relatively few bars outside of the places that tourists and more cosmopolitan upper-class Guatemalans frequent. My students were limiting themselves to two drinks per day maximum and didn’t drink at all on most days, but the host parents of one family were so worried about that amount of alcohol consumption that they asked us to talk to the student about drinking less. And this was a family that drank alcohol on many weekends themselves, so they weren’t teetotalers, but they did not like having it around more than occasionally. I never saw Guatemalans drinking for a public celebration like you frequently see at a Cinco de Mayo event in the US.

On the other hand, most European nations drink even more than the US. My son just got back from hiking across Spain where average alcohol consumption is 22% higher than in the US. Most food and drink were more expensive in Spain than in the US, but alcohol was the main exception. He even came across a wine fountain where the public can drink wine for free:

That is the kind of commitment to alcohol culture that keeps consumption high in Europe.

Similarly, Europe smokes more than the US and Latin America smokes the least of any part of Western Civilization despite the fact that tobacco originated in America. 

Mexicans smoke about 1/3 as much as Americans and Guatemalans smoke about one ninth as much.

Posted in Globalization & International, Health

Many whites are uneasy about becoming a minority in America. It isn’t happening. They should relax.

The media tends to use the narrowest racial definitions in order to stoke anxiety because that brings readers, but those definitions are arbitrary and more inclusive racial definitions are more accurate because the biggest growth is the rise in interracial marriage which means that more and more of the population is both white and Hispanic or both Asian and black. Matthew Yglesias explains:

Most media coverage of America’s demographic future sees the country approaching a significant tipping point over the course of the next generation, with headlines like the Associated Press’s “Census Bureau estimate: Whites won’t be majority by 2044” typical of the genre. The Census Bureau itself somewhat encouraged this kind of coverage of its 2014 demographic projections, doing things like releasing an infographic titled “Projecting Majority-Minority: Non-Hispanic Whites May No Longer Comprise Over 50 Percent of the US Population by 2044.” There is, however, another way of looking at it. The very same census report projects that as far out as 2060, 68.5 percent of the population will be white. It’s just that a reasonably large share of the white population will be partially descended from Latin American immigrants. A further 6.2 percent of the population will belong to “two or more races,” with a large share of those likely identifying at least in part as white. The difference here is between an exclusive and inclusive definition of whiteness. It’s clear that in the face of rising intermarriage rates, a larger share of the population will be at least partially descended from Asia or Latin America, while the partially black share of the population will grow at a more modest rate. But many of these people will, like me, be of predominantly European ancestry and have skin tone and other facial features that fit comfortably within the conventional boundaries of whiteness. If you use the exclusive version of whiteness — in which anyone who’s part anything is perforce not white — then you get a majority-minority America by 2044. If you use an inclusive view and let anyone who identifies as white be white, then America remains majority white indefinitely. And a new study from Dowell Myers and Morris Levy, a demographer and a political scientist at USC, respectively, suggests that the media’s choices about how to characterize it make a real difference to people’s political response to these demographic trends. In essence, media narratives that take a narrow view of whiteness and suggest that the falling share of 100 percent Europeans in the population means the end of America’s white majority generate “much higher levels of anger or anxiety” than alternative (and, frankly, more plausible) characterizations of the situation. The implication is that a premature rush to proclaim the end of white America, even when intended in a celebratory manner, may be fueling racial backlash politics. …A different, “inclusive” account allows for the fact that a person of mixed ancestry might identify as white and as Asian and that many people who identify as Hispanic also identify as white or black or Native American. These two methods lead to very different characterizations of the present-day white share of the population, which is either an overwhelming 80 percent of the public or else a tenuous majority of 62 percent:

The gap between the 2014 “exclusive” racial categories and the “inclusive” categories is 20%, so about 20% of the people in this survey see themselves as belonging to more than one racial identity. Almost 18% of the survey sees themselves as both white and some other race too. Accepting them as white won’t satisfy the white supremacists, but most white people who get anxious about the changing racial demographics are just nervous about becoming a minority, and that is NOT happening.

There was a similar political dynamic a century ago when there was a movement to restrict immigration because of worries that immigrants were changing mainstream American culture. At that time, incoming Italians, Poles, and Jews were not considered white by the nativists and Irish immigrants have been similarly denigrated at times in US history, but American became more inclusive. We should continue in that inclusive tradition. When people see themselves as being part of the great American melting pot, we should identify them as they identify themselves.

Posted in Discrimination, Labor

Would universal health care boost growth in developing nations?

The Economist Magazine argues that the entire world should adopt universal health care because

universal health care is both desirable and possible, even in low-income countries. Some countries achieved near-universal coverage when they were still relatively poor. Japan reached 80% when its GDP per person was about $5,500 a year. More recently, several developing countries have shown that low income and comprehensive health care are not mutually exclusive. Thailand, for example, has a universal health-insurance programme and a life expectancy close to that in the OECD club of mostly rich countries. In both Chile and Costa Rica income per person is roughly 25% of that in the United States and health spending per person just 12%, but life expectancy in all three countries is about the same. Rwanda’s GDP per person is only $750, but its health scheme covers more than 90% of its population and infant mortality has halved in a decade. “Ebola would not have happened there,” says Dr Barrie.

Healthcare is usually an example of a good that is produced more efficiently when it is more equally distributed. For example Ebola only spread in countries that lacked the kind of basic healthcare facilities that even nations as poor as Rwanda can afford if they are trying to make healthcare equitable. That makes everyone better off and can boost economic growth too.

It is becoming increasingly clear that better health can lead to higher incomes, as well as the other way around. Economists at the World Bank used to call spending on health a “social overhead”, but now they believe that it speeds up growth, says Timothy Evans, one of its senior economists. A study in 2011 carried out by the University of St Gallen looked at 12 European countries between 1820 and 2010 and found a close link between the expansion of health care, a fall in mortality rates and growth in GDP per person. Another study found that in Britain as much as 30% of the growth in GDP between 1780 and 1979 may have been due to better health and nutrition. A paper by two leading economists, Dean Jamison and Lawrence Summers, found that 11% of the income gains in developing countries between 1970 and 2000 were attributable to lower adult-mortality rates.

The US is the least efficient nation at producing health care partly because the US is the only rich nation that does not guarantee universal health care to all our citizens. Even China was close to surpassing the US back in about 2008 according to the Economist’s graph and Mexico has been rapidly catching up. If they can do it, the US can too

Posted in Development, Health

House prices are crazy overvalued in Canada too

Friends in Canada were interested in the evidence I wrote about earlier of the housing bubble in New Zealand, and the story is nearly identical for Canada, so this is a copy of my prior post with graphs from The Economist magazine for Canada instead of New Zealand.  The story looks almost identical except Canada is slightly less overvalued.

There are two main references for measuring a housing bubble. The first is the ratio of prices to buy versus the cost to rent. If housing prices are driven by economic fundamentals, rents and prices should both rise or fall in parallel because the same things that make a location desirable to own should make it desirable to rent, but housing prices fluctuate much more than rents. By this measure, Canada is in extreme bubble territory and the US is only moderately overvalued on average:

housing bubble canada

The second measurement to diagnose a real estate bubble is the ratio of housing prices to mean disposable income. You might think that I would prefer median income, but this is one of those places where mean income probably does a better job because rich people spend A LOT more money buying houses than people below the median, so mean income is a more useful measure.

The main determinant of housing prices is the income of the people who live in the area. Whenever local incomes rise, local housing prices rise and vice versa.  Again, by this measure Canada is in bubble territory in the highest tercile of household income going to housing of any nation in the OECD database.

canada housing bubble

Remember the fabled US housing bubble that crashed in 2007 and brought down the global economy?  That bubble was tiny compared to what is happening now in Canada.

In the very long run, the real (inflation adjusted) rise in house prices is very, very low because although land values have risen, construction technologies have reduced the real cost of building, just like with almost all other manufactured goods.  Some people think that rising population would cause housing prices to rise, but if dense population caused prices to rise, then Japan would have some of the least affordable housing in the world, but the Japanese spend a smaller fraction of their money on housing than Americans and British people do:

Chart 1

Robert Schiller estimated the real change in housing prices over two centuries and concluded that they stay pretty constant in the very long run so a final way to examine whether there is a bubble is to compare current housing prices with the real, long-term average price history as in the graph below.  This measure also confirms the earlier data: US housing is a bit overvalued whereas Canada’s prices are stratospheric.

housing canada bubble

Note that Australia and New Zealand have real estate price histories that are extremely similar with that of Canada. It is almost like they have the same economic forces acting upon them (high immigration being one factor in common) and those forces are completely different from what is happening in the US real estate markets. The British market is somewhere between the Canadian pattern and the US pattern.

Where is the money coming from to blow up those bubbles?  I doubt it is a repeat of the securitization scam that caused the US housing bubble.  My best guess is that it is coming from immigration policies that award citizenship to rich foreigners who bring a large lump of money into their new nations.  Those foreigners have the money and incentive to buy real estate.  But that is just a guess.

australia new zealand housing bubble

The bottom line is you should avoid buying real estate in Australia, Canada, and New Zealand because it is currently cheaper to rent and sock away savings in other places. According to the Economist magazine data, these are some of the very biggest housing bubbles in history.  People in those nations don’t have a memory of a major real estate crash (at least since 1970), and if they are like people in most nations in a similar situation, they are probably spreading urban legends about how real estate is the safest investment because it rarely ever goes down in value.  That is the kind of story most Americans were telling themselves in 2007, just before the housing crash caused the Great Recession and that is what many Japanese were saying in 1990 just before their housing crash led into their lost decade. The Japanese housing market still has not recovered and that bubble was tiny compared to what is going on in New Zealand, Canada, and Australia.  Housing crashes are extremely common as shown in the international data at the Economist link above. Nobody knows when the crash will come, but it will come.

In fact, because housing crashes are so often accompanied with overall economic malaise, it would probably be a good idea for residents of the bubble markets to diversify their investments into foreign stocks.  Their domestic stocks should emphasize companies that do a lot of exporting rather than companies that rely upon domestic consumption.  Be particularly careful about buying stock in domestic banks that specialize in housing lending.

Housing is arguably the most important form of capital!  The Economist says:

the world’s biggest asset class is actually residential property. With an estimated value of about $200trn, homes are collectively worth about three times as much as all publicly traded shares.

Posted in Globalization & International, Macro, Real Estate

Now is the best time for Americans to list a house for sale

According to data from the National Association of Realtors, US housing prices are higher now than they have been in six years and more of them are selling at the asking price or above. Furthermore, early summer is the best time to sell your house because more houses get sold at their asking price and the median prices are higher.  I’ve heard that before, but both of these data series confirm the anecdotes.

In fact, the median price in the summer is over 20% higher than the median price in the winter, so the magnitude of the seasonal swing is enormous.  Much bigger than I would have guessed. Assuming it takes about two months to get a house listed and sold, then about now is the sweet spot to start listing a house for sale.

And although US mortgage delinquency rates are not all the way down to normal, they are way down from the peak, so the housing market is healthier than it has been in a decade:

Posted in Macro

House prices are a bit high in the US and crazy overvalued in New Zealand

I talked with friends in New Zealand (Tim and Jo) over the weekend who told tales that sounded like there is a housing bubble in New Zealand, so I looked up some data at The Economist magazine and sure enough, massive bubble. There are two main references for measuring a housing bubble. The first is the ratio of prices to buy versus the cost to rent. If housing prices are driven by economic fundamentals, rents and prices should both rise or fall in parallel because the same things that make a location desirable to own should make it desirable to rent, but housing prices fluctuate much more than rents. By this measure, New Zealand is in extreme bubble territory and the US is only moderately overvalued on average:

The second measurement to diagnose a real estate bubble is the ratio of housing prices to mean disposable income. You might think that I would prefer median income, but this is one of those places where mean income probably does a better job because rich people spend A LOT more money buying houses than people below the median, so mean income is a more useful measure.

The main determinant of housing prices is the income of the people who live in the area. Whenever local incomes rise, local housing prices rise and vice versa.  Again, by this measure New Zealand is in super-bubble territory with the highest percent of household income going to housing of any nation in the OECD database.

Remember the fabled US housing bubble that crashed in 2007 and brought down the global economy?  That bubble was tiny compared to what is happening now in New Zealand.

In the very long run, the real (inflation adjusted) rise in house prices is very, very low because although land values have risen, construction technologies have reduced the real cost of building, just like with almost all other manufactured goods.  Some people think that rising population would cause housing prices to rise, but if dense population caused prices to rise, then Japan would have some of the least affordable housing in the world, but the Japanese spend a smaller fraction of their money on housing than Americans and British people do:

Chart 1

Robert Schiller estimated the real change in housing prices over two centuries and concluded that they stay pretty constant in the very long run so a final way to examine whether there is a bubble is to compare current housing prices with the real, long-term average price history as in the graph below.  This measure also confirms the earlier data: US housing is a bit overvalued whereas New Zealand’s prices are stratospheric.

Note that Australia and Canada have real estate price histories that are extremely similar with that of New Zealand. It is almost like they have the same economic forces acting upon them (high immigration being one factor in common) and those forces are completely different from what is happening in the US real estate markets. The British market is somewhere between the New Zealand pattern and the US pattern.

Where is the money coming from to blow up those bubbles?  I doubt it is a repeat of the securitization scam that caused the US housing bubble.  My best guess is that it is coming from immigration policies that award citizenship to rich foreigners who bring a large lump of money into their new nations.  Those foreigners have the money and incentive to buy real estate.  But that is just a guess.

The bottom line is you should avoid buying real estate in Australia, Canada, and New Zealand because it is currently cheaper to rent and sock away savings in other places. According to the Economist magazine data, these are some of the very biggest housing bubbles in history.  People in those nations don’t have a memory of a major real estate crash (at least since 1970), and if they are like people in most nations in a similar situation, they are probably spreading urban legends about how real estate is the safest investment because it rarely ever goes down in value.  That is the kind of story most Americans were telling themselves in 2007, just before the housing crash caused the Great Recession and that is what many Japanese were saying in 1990 just before their housing crash led into their lost decade. The Japanese housing market still has not recovered and that bubble was tiny compared to what is going on in New Zealand, Canada, and Australia.  Housing crashes are extremely common as shown in the international data at the Economist link above. Nobody knows when the crash will come, but it will come.

In fact, because housing crashes are so often accompanied with overall economic malaise, it would probably be a good idea for residents of the bubble markets to diversify their investments into foreign stocks.  Their domestic stocks should emphasize companies that do a lot of exporting rather than companies that rely upon domestic consumption.  Be particularly careful about buying stock in domestic banks that specialize in housing lending.

Update: Here is the data about the growth in the housing-price/rent ratio since 2015 presented as a map by Jeff Desjardins:

house-rent

Posted in Globalization & International, Macro, Real Estate

How to eliminate most of the inefficiency of doing taxes

Americans waste way too much time and money preparing their taxes. There is a much more efficient information-age technology that other nations use which eliminate the entire burden for most citizens.

If I’m not itemizing deductions (like 70 percent of taxpayers), the IRS has all the information it needs to calculate my taxes, send me a filled-out return, and let me either send it in or do my taxes by hand if I prefer.

This isn’t a purely hypothetical proposal. Countries like Denmark, Sweden, Estonia, Chile, and Spain already offer “pre-populated returns” to their citizens.

In a number of countries, like Japan and the UK, the vast majority of people don’t have to file tax returns at all, pre-populated or otherwise.… Closer to home, California has a voluntary return-free filing program called ReadyReturn for its income taxes.

Austan Goolsbee, former chief economist for the Obama administration, designed a proposal called “The Simple Return” in 2006 that would provide pre-populated returns for everyone not itemizing their deductions. …

Ronald Reagan touted the idea in a 1985 speech… So why hasn’t return-free filing happened yet? The short answer is lobbying, and in particular lobbying by companies like Intuit.

…Intuit and other tax prep companies had a powerful ally: Grover Norquist. The anti-tax crusader vehemently opposes automatic filing on the grounds that it makes tax season insufficiently nightmarish, which might reduce people’s aversion to taxes and make it easier for politicians to pass tax increases. So even though Ronald Reagan himself supported automatic filing, Norquist has helped make the idea dirt in the eyes of conservative legislators.

Boycott tax preparers and save yourself some money too. Dylan Matthews again:

TurboTax is an evil, parasitic product that exists entirely because taxes are confusing and hard to file. Worse than that, Intuit is one of the loudest voices on Capitol Hill arguing against measures that make it easier to pay taxes. Years ago, the Obama administration proposed a system of automatic tax filing, in which the IRS uses income information it already has to fill out your tax return for you. That would save millions of Americans considerable time and energy every year, but the idea has gone nowhere. The main reason? Lobbying from Intuit and H&R Block.

Don’t give Intuit money. Don’t give H&R Block money. To do so is to perpetuate the status quo in which you have to file your own taxes in the first place. 

Posted in Public Finance

Enter your email address to follow this blog and receive notifications of new posts by email.

Join 75 other subscribers
Blog Archive
Pages