I just finished listening to the Census Bureau press conference about their latest releast of median income, poverty, and healthcare data. The startling news is this:
Real median incomes in 2015 for family households ($72,165) and nonfamily households ($33,805) increased 5.3 percent and 5.4 percent, respectively, from their 2014 medians. This is the first annual increase in median household income for family households since 2007.
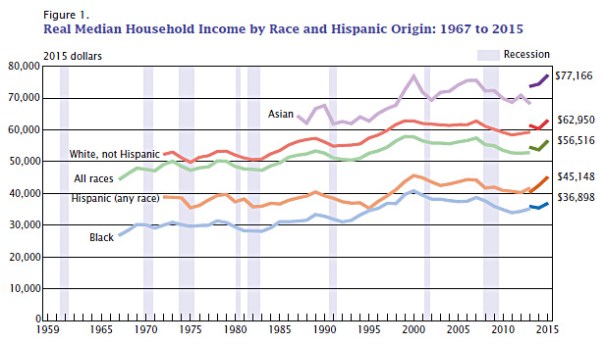
5.4% is a HUGE increase in real median income! Another year like that and we will be higher than ever before. We are now only, “1.6 percent lower than the median in 2007, the year before the most recent recession, and 2.4 percent lower than the median household income peak that occurred in 1999.”
The bad news is that real median income is still only slightly above where it was in the early 1970s, but at least we have had a great year.
There have been a lot of stories in the press that try to argue that the political success of Donald Trump is largely due to economic difficulties among working class whites who blame immigration and trade for their economic woes, but there isn’t any data to support that idea and the latest Census data demolishes it. All the latest economic statistics in the report look really good. There just isn’t anything in the report to support the popular media narrative that working-class whites have been experiencing more economic hardship which has driven them to vote for Trump.
Ordinary Americans were doing better economically in 2015 than they were at any time since the peak of the economic bubble at the end of the Bush administration in 2007 and although we don’t have median income data for 2016, there is nothing in any of the more up-to-date economic statistics to suggest any significant problems.
Although the Census data is aggregate data, in the past that kind of economic data has been an excellent predictor of voter sentiment. However, this year it is failing and so it is important to look at data comparing individual Trump supporters with individuals opposing him to better understand their situation. Jonathan Rothwell at Gallup did just that in a publication last week. Rothwell’s data also contradicts the narrative that Trump supporters have rejected mainstream Republican candidates as a reaction to economic hardship. Dylan Matthews summarizes:
both across the overall population and among whites, support for Trump is correlated with higher income, not lower. ….”The individual data do not suggest that those who view Trump favorably are confronting abnormally high economic distress, by conventional measures of employment and income,” he concludes.
Nonetheless, Trump supporters tend to be blue-collar and less educated: …[This] suggests that his sweet spot is less-educated people in blue-collar fields who are nonetheless doing pretty well economically.
Trump does well in racially segregated areas: Turning to the geographic data, Rothwell finds that segregated, homogenous white areas are Trump’s base of support. “People living in zip codes with disproportionately high shares of white residents are significantly and robustly more likely to view Trump favorably,” he writes. “Those living in zip codes with overall diversity that is low relative to their commuting zone are also far more likely to view Trump favorably.” Put another way: If you’re in the whitest suburb in your area, you’re likelier to back Trump.
Trump doesn’t do well in areas affected by trade or immigration: This is perhaps the most surprising finding. Contact with immigrants seems to reduce one’s likelihood of supporting Trump, as areas that are farther from Mexico and with smaller Hispanic populations saw more Trump support.
Many of the Trump voters I know don’t really like Trump, but merely hate Hillary Clinton more and find Trump to be the lesser of two evils. In a poll published three days ago, about 1/6 of the Americans who plan to vote for Trump indicated that he is unqualified to be president because 41% plan to vote for him, but only 36% think he is qualified!
It is possible that a few of the Trump supporters in Rothwell’s surveys are mainstream Republicans like Paul Ryan and Mitt Romney who dislike Trump, but will begrudgingly vote for him because they hate Clinton worse, but this issue is probably trivial because Rothwell was only looking at the 33% of American respondents who actually said that they view Trump favorably, not whether they intended to vote for Trump, and many of the surveys were done during the primaries when conservative respondents had many other viable candidates to oppose Hillary.
Update: The good economic news isn’t quite as good as it first appears.


[…] Census just announced a historically rapid rise in median household income which is cause for celebration, but the reason why it rose is a bit less heartening. Basically, […]