Life expectancy is the mean number of years someone is expected to live if conditions would remain the same in the future as they are in the current year. But because life expectancy is slightly skewed to the left, David Spiegelhalter calculated that median life expectancy is about three years longer than the mean. That means that most people should expect to live longer than their life expectancy as it is usually calculated.
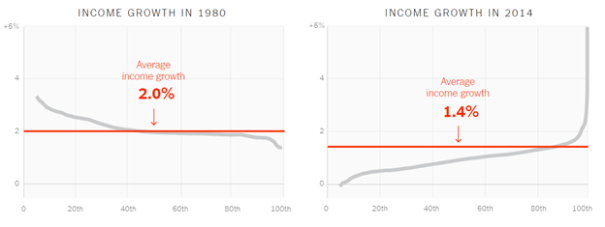
It’s well-known how misleading it can be to use average (mean) as a summary measure of income: …a few very rich people can hopelessly distort the mean. So median (the value halfway along the distribution) income is generally used, and this might fairly be described as the income of an average person, rather than the average income.
But, like everyone else dealing with actuarial statistics, I use life expectancy (the mean number of future years) to communicate someone’s survival prospects. And yet, just as for income, it is also a poor measure due to the skewness of the distribution of survival.
This can be clearly shown by looking at the life tables published by the Office for National Statistics (ONS) …[with] the expected number of deaths at each age out of 100,000 births, assuming the current mortality rates continue. The density plots for women and men are shown below, using the life tables for 2010-2012. The distributions have a small peak for babies dying in the first year of life, and then a long left-tail for early deaths, and then a sharp peak and a rapid fall up to age 100. The ‘compression’ of mortality is clear.
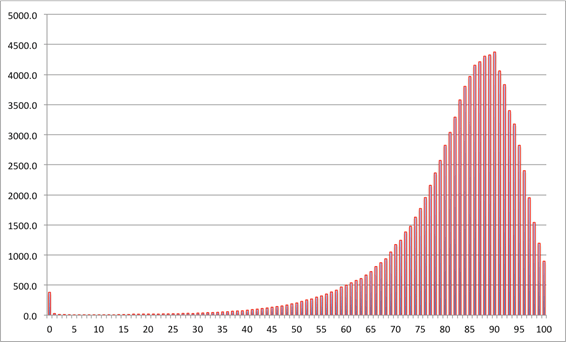
Numbers of women expected to die at each age, out of 100,000 born, assuming mortality rates stay the same as 2010-2012. The expectation is 83, median 86, the most likely value (mode) is 90.
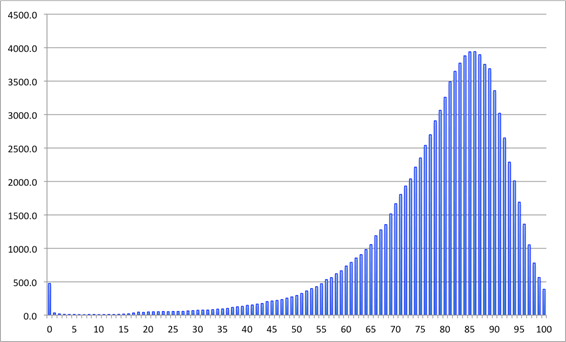
Numbers of men expected to die at each age, out of 100,000 born, assuming mortality rates stay the same as 2010-2012. The expectation is 79, median 82, the most likely value (mode) is 86.
Left-skewed distributions are rather unusual, but have similar issues as any skew distribution – the mean, median and mode can be very different. For these survival distributions it is perhaps remarkable how far the mode is from the mean: for girls born now, even assuming there are no more increases in survival, their most likely age to die is 90, seven years more than the mean on 83. For little baby boys the mode is 86, again seven years more than the mean of 79. And even the median is 3 years more than the mean. That’s why I now believe that ‘life expectancy’ is misleading.
In the comments, Nick Ergodos* opines that:
I think the median beats the mean at every level and for all practical purposes, not only for estimating life expectancy or income. For large sample sizes (or if you repeat the experiment many times) the median approaches the mean anyway so nothing is lost by replacing the mean by the median everywhere. We use the average routinely for historical reasons only, not really for any rational reasons.
I don’t agree with Nick that the median always beats the mean, but it certainly does for income. The best statistic depends upon how it is used and there is no use where mean income is better (unless you are using the mean of log income which produces results that are a rough approximation of the median anyhow). For life expectancy, both measures have different advantages. The median is more realistic for most people (obviously) who have already survived past youthful mortality and gives a better picture of how many years of life they have left. But as a measure of social wellbeing, I’m fine with using mean life expectancy because it gives more weight to the tragedy of youth mortality than median life expectancy does. Most of the increase in (mean) life expectancy over the past two centuries has been due to a reduction in youth mortality and median life expectancy wouldn’t reflect that incredible gain in human wellbeing.
The difference between why mean life expectancy is OK and mean income isn’t OK for measuring welfare (utility) is that a mean assumes constant marginal utility. It is more reasonable to assume that each year of life gives about the same amount of utility than to assume that every dollar of income gives exactly the same amount of utility. That is the philosophical reason why I use standard (mean) life expectancy for calculating MELI rather than median life expectancy. The other reason is practical. As I discovered at the IARIW conference in Korea, it is hard enough to get economists interested in using median income and it would be a harder sell to get them to also switch to median life expectancy. Fortunately, the ordinary way of calculating life expectancy is just fine as a measure of wellbeing even though it isn’t as good for estimating how long you have left to live.
Of course there is only a three year gap between the two measures today, so there isn’t a large difference, but in the late 19th century, the gap was ten years because child mortality was much bigger. And median life expectancy is better for retirement planning. People tend to underestimate their lifespans (especially women) and this may be part of why people do not save enough money for retirement. This is understandable when mean life expectancy underestimates life expectancy for most people and it is THE ubiquitous measure of lifespan. Even the Social Security Administration uses the wrong measure for its retirement planning longevity calculator and if anything, longevity has tended to increase over time (until the crisis of the last three years in the USA), so the period life expectancy has consistently underestimated actual cohort life expectancy for almost two centuries. And if you really want to predict your individual life expectancy, you can get a much better prediction by including risk factors. People who earn more than the median income live a lot longer than poorer people in the US. Other strong predictors include more education, being female, and health and family histories. Life insurance corporations have spent a lot of money on proprietary models that predict how long you will live, but unfortunately most of their research is secret.
*For the wonkish, Nick Ergodos further explains his theory in a published paper that makes a more limited claim about the virtues of the median. It focuses on expected value and argues that the median probability of a gain (or loss) should be used (and is used my most people) for deciding whether or not to make a series of bets rather than the probability-weighted mean (which is the expected value). It is an intriguing theory, but I don’t think it is completely specified for the domain where it works versus where it doesn’t.