Median living standards would be higher and inequality would be lower with better zoning regulations

Kevin Erdmann at Idiosyncratic Whisk has done a number of analyses using median income. For example, below are two graphs showing an analysis of the distribution of median income across US metropolitan areas. The three lines on the graphs show that America got more unequal in each year from 1979 to 1995 to 2015.  By 2015, the median income in the richest metropolitan area was 40% higher than the median for the nation as a whole and the poorest metropolitan area was 40% poorer than the median for the nation.

The point of his analysis is to point out how much of the inequality in median income is disguised by differences in rent. For most cities, he says,

the change in income distribution after rent is the reverse of the change before rent. The poorest cities actually gained on the average, and high income cities lost. In other words, workers in the high income cities were paying all of their income gains, and more, to their landlords…

The irony is that the best policy we could institute for reducing all these forms of economic inequality between workers and capital is to build hundreds of thousands of high end housing units in the core areas of San Francisco, San Jose, and New York City. In fact, this is the only policy that can accomplish that task.

Our housing market is causing problems in two ways. First, we aren’t building enough housing in cities like in silicon valley where the job market is expanding rapidly. Second, we aren’t building enough housing for middle and low income people. This refutes the idea that we just need to build more high end housing units. A lot of people argue that we should help the middle class afford housing by allowing developers to build more high-end housing for the affluent who move up to more gentrified housing and leave vacant units for less wealthy people. I agree that this is a good idea, but the benefits of expanded housing supply don’t necessarily trickle down to everyone. Fed economists Jonathan McCarthy and Richard Peach write that

As one moves down the rent level distribution, increases in the supply of housing increasingly come from previously higher-rent units, which may still have rents above the average of the incumbent units, pushing up rents more in such segments.

Patrick Clark at Bloomberg summarizes their research that trickle down housing hasn’t been enough:

In big, expensive cities such as New York and Los Angeles, rising rental costs are straining middle-class budgets. Historically, though, rents have hit low-income tenants the hardest… From 1993 to 2013, the cost of the cheapest 20 percent of U.S. rental units has increased more than 10 percent a year, according to the New York Fed analysis of data from the Census Bureau’s American Housing Survey. Meanwhile, the rents of apartments and houses in the priciest 20 percent were flat over time.

The big reason why we aren’t building housing to help boost real living standards for the median American is zoning regulations that make it expensive to build housing in places like silicon valley and that make it hard to build housing for anyone except elites. Perhaps this is why we are selling more detached housing than in the past even though multi-unit housing is more efficient and affordable than detached single-family homes.

Posted in Medianism

Celebrate the highest median earnings in American history (unless your money comes from owning rather than from working.)

The BLS released data Thursday showing that real median full-time workers reached all-time high earnings last year: $347/week. This is cause for celebration, but realistically, it is only 3.5% higher than it was in the 1970s so it is pretty dismal in the big picture. The average American worker has gotten a raise that would not even be terribly exciting in a single year, much less spread out over 37 years!

Whereas median full-time wages rose 3.5% during this period, real mean GDP rose 78% which means that somebody’s income rose by more than 78%. Guess who that was? It was mostly people who earn above the median income, but also there was a tiny increase in the percent of the population that is working full time from about 35% to about 38%.

Median earnings of full-time workers is a useful statistic, and I see no reason to question the data showing an all-time high right now, but the big problem with this data is that most Americans don’t work at all for pay and it neglects to measure anything about them. When unemployment rises, median earnings tends to rise which seems perverse.  This is because wages are sticky and low-wage workers are much more likely to get laid off than high-wage workers.  For example, during 2008 the median full-time earnings spiked upwards to the previous all-time high mainly because unemployment spiked to one of its all-time highs. Today we are in a completely different situation because unemployment is low, so this time the high wage really does represent a labor market that is increasing average prosperity, but you do need to think about other measures like unemployment when interpreting this graph.

Whereas workers will celebrate this rise in our average income, our corporate leadership thinks that higher wages are a bad because they don’t like rising labor costs. Most of the Fed leadership has tended to agree that it is a bad thing because they are in social circles that are closer to corporate executives than to the median American. The Fed tends to complain that this is a sign of inflation and it raises the likelihood that they will raise interest rates at their next meeting. That would tend to push wages back down and decrease hiring. Since the 1970s, the Fed has tended to raise interest rates (which increase the safe return to capital) whenever the wages of labor start rising which keeps wages from rising. Perhaps this is one reason inequality has been rising. The income of capital has risen relative to the income of labor and capital is mostly owned by the wealthy.

Posted in Medianism

One way power corrupts is by reducing social constraints

Brian Resnick warns that Trump would be a terrible president not because the enormous power of the presidency would corrupt him, but because it would merely give him more freedom to reveal his true personality.  As if we haven’t seen enough of that already.  Resnic confusingly claims that “power doesn’t corrupt,” and then spends most of his article showing how power does indeed corrupt.  He begins by saying that power doesn’t corrupt; it just removes social constraints on our actions:

The more powerful we are, the more free we are to act on our base desires…. When we’re not in a position of power, we’re constrained by social norms and expectations. We make decisions that don’t rock the boat, we’re maybe more polite, we’re less confident in our ideas. “Power removes some of that,” Kraus tells me. When those barriers are removed, the “true self” — meaning a person’s personality, the gut way they react to the world — is revealed…

As Michael Kraus… wrote recently at Quartz, power is only likely to magnify the negative characteristics in a man like Trump. But for an interesting reason: It’s not that power is, by itself, corrupting. It’s that “power simply brings our true nature out into the open,” Kraus writes….  that when people feel powerful, they’ll behave more consistently: whether they’re among relatives or friends, whether they’re posting to Facebook or to a dating website. The context of the situation doesn’t get in the way of the self….

So power can magnify the personality by removing social constraints, but social constraints generally evolve to help the average person be less corrupt, not more.  Unless an individual is so moral as to be much less corrupt than the social constraints produced by her community, then removing social constraints is just going to increase corruption. At best, this line of research is evidence that some people are very intrinsically altruistic and these people can handle power better than most.  This is pretty flimsy support for the idea that power doesn’t tend to corrupt.  Then Resnick spends most of the rest of the article writing about research showing that power does indeed corrupt:

Keltner writes about many studies that show the subtly sinister influence of power.

  • More powerful people are less empathetic, and are literally less able to read emotion in the eyes of others.
  • More powerful people are less likely to take the perspective of others. In one very simple but small experiment — only 57 subjects — participants were asked to draw the letter E on their foreheads. The participants who felt more powerful were less likely to draw the letter so that others could read it correctly. Here’s what I mean:
 Psychological Science
  • Powerful people are more self-serving. In an experiment, Keltner brought groups of three participants into the lab and had them play a game where one was given the role of the leader. He then brought out five cookies as a snack. “And indeed, the high-power participants were nearly twice as likely to grab a second cookie, with their peers looking on,” Keltner writes.

Powerful people, as measured by job status, are more likely to report that they’ve had an affair (which suggests that they either felt freer to engage in the action or felt less shame in admitting it). In other surveys, “people feeling powerful were more likely to say it’s okay to not pay taxes, and that there’s nothing wrong with over reporting travel expenses or speeding on highways,” Keltner writes.

The powerful are also more prone to hypocrisy. One 2010 paper out of Northwestern and Tilburg universities found evidence that while powerful-feeling people judge others more harshly for breaking rules, they cut themselves some slack when they bend the rules. “People with power take what they want not only because they can do so without punishment, but also because they intuitively feel they are entitled to do so,” the paper concluded.

Rich people drive less considerately and cheat more in games.  Paul Piff and colleagues wrote a paper called, “higher social class predicts increased unethical behavior.”  Lisa Miller explained how it shows that power corrupts:

quizzes, online games, questionnaires, in-lab manipulations, and field studies [showed] that living high on the socioeconomic ladder can, colloquially speaking, dehumanize people. It can make them less ethical, more selfish, more insular, and less compassionate than other people. It can make them more likely, as Piff demonstrated in one of his experiments, to take candy from a bowl of sweets designated for children. “While having money doesn’t necessarily make anybody anything,” Piff says, “the rich are way more likely to prioritize their own self-interests above the interests of other people. It makes them more likely to exhibit characteristics that we would stereotypically associate with, say, assholes.”

Wealth is economic power and perhaps Jesus understood the social science research when he told the rich man to give everything to the poor in order to gain riches in heaven in Matthew 19 (and Luke 18).  Then Jesus said:

Again I tell you, it is easier for a camel to go through the eye of a needle than for someone who is rich to enter the kingdom of God.”

Of the other extreme, there is no point in worshipping poverty for its own sake.  Mother Teresa’s organizations have been accused of doing just that and they refuse to be accountable for the vast donations that they take in.  This might be a case where reducing their financial secrecy might provide a useful social constraint.  Secrecy and knowledge are also forms of power that economists often call ‘asymmetric information’.


Posted in Development, Public Finance

How to improve median income statistics

The Obama administration touted news reports like this one from the Washington Post: Middle class incomes had their fastest growth on record last year. The Census Bureau itself was a bit more circumspect because they recognize that there is considerable uncertainty in their median income statistics because very few resources go into measuring it. They only claimed that it was the fastest growth in median income since 1997-98 even though their data shows that the Washington Post is correct in saying that it is the fastest measured increase ever. The Census Bureau made a more modest claim because there is over a percentage point of uncertainty in their estimates.

It is rare for economic statistics to include estimates of uncertainty like this and the fact that it is easy to estimate uncertainty for median income demonstrates that median income is really easy to measure. It is also a demonstration of how unimportant median income is that we tolerate such an unprecise measure. As I explained in a WLIO TV interview last week, there are a number of simple things we could do to improve the measure.

First, rather than using a tiny Census sample, we could simply use income tax data and that would make the measurement extremely precise at approximately zero cost.

It would also eliminate the minor controversy about the effect of the changing Census survey methodology which also boosted the official measure. Most people don’t care about median income, so it hardly got any press, but the Census started changing their methodology in 2013 in a way that would tend to boost the measure in later years. The Census believes that they had been undercounting median income in previous years. In contrast, income records from the IRS would be much more comprehensive and consistent over time, so there would be less possibility for this kind of problem.

Secondly, we need to adjust for changes in household size which has been falling. That would have boosted real median individual income over time as household size shrinks.

Third, we should combine median income with life expectancy data to calculate median expected lifetime income (MELI). That would not only add richness by including our most powerful measure of health, but it would also correct the demographic effects of an aging population.

Fourth, we should use a better inflation index. The Census Bureau uses the rather odd CPI-U-RS for comparing growth in median income over time. Nobody else uses this. Sentier Research uses the CPI to adjust median income and this is a more standard measure that makes the growth in median income look worse. The CPI-U-RS has been essentially the same as the CPI since the late 1990s, but before that, there were substantial differences. But the best measure of inflation is probably the PCE price index which would show even more optimistic growth than the census bureau as Doug Short demonstrates:


Fifth, we should try to measure real income better. Ideally we should subtract off the value of taxes because that isn’t really income and we should add in the value of government benefits like education and healthcare, but the latter is really controversial to do, so either pre-tax income or after-tax income is probably all we are going to get for now because it is easy to measure cash flow and it is harder to measure non-cash benefits like the value of employer-provided health insurance. Also, homeowners get a large stream of economic benefit from living in their homes rather than paying rent. This should be included in income measures too, but it would be a bit more expensive to add this detail so it is rarely attempted.

Matthew Yglesias at Vox has ideas about how to improve median income measures that substantially overlap with mine.

Posted in Medianism, MELI & Econ Stats

I don’t know whether to Laffer or cry

Jordan Ellenberg’s book also points out that the Laffer curve is another example of non-linear thinking. The idea is so common today that it now seems obvious, but in the 1970s it was so novel to most people that they gave it a new name even though it was already a very old idea for economists. They named it after Arthur Laffer who helped found a political movement known as supply-side economics based largely on this idea. Supply-side economics never developed much following among academic economists,* but it soon became a dominant economic ideology in the Republican party and as a result, Ronald Reagan reduced the top income tax rate from 70% down to 28%. 70% seems like a politically impossible rate given that Obama faced tremendous opposition against raising the top rate from 35% to 39.6% in 2013, but it had been 70% without much controversy through the 1960s and 1970s and it had been 90% or higher during the 1940s and 1950s.

Although many textbooks draw the Laffer curve as peaking at around a 50% tax rate, that is probably just because the half-circle curve looks prettier than a more realistic curve like the one below which is based upon research by Trabandt and Uhlig (2011). Even this is a somewhat rough approximation, but it is about as good as we have at this point.

Unfortunately, many supply-side politicans haven’t paid much attention to their own theory and act like cuts in income taxes will always INCREASE tax revenues! They have fallen into linear thinking, but flipped the ordinary logic. In reality, despite Laffer’s claims to the contrary, the Reagan tax cuts caused a large increase in deficits in the early 1980s and the Clinton tax increases caused a large decrease in the deficit in the mid 1990s and then the Bush tax cuts caused the deficit to balloon again in the 2000s.

The Laffer-curve intellectual revolution largely explains why a 39% top tax rate seems almost impossibly high in the modern era even though it is only about half of what it was for nearly half of the 20th century. Proponents of supply-side economics claim success by arguing that incomes of wealthy people skyrocketed after taxes dropped on wealthy Americans. They tend to believe that people’s pay represents their productivity and so if rich people are getting paid more, then it must be due to higher productivity and higher productivity should benefit us all. The theory says rich people are the main job creators and if they get more productive, they will create more jobs to help all Americans.

Supply-side economics has been an unqualified success for the rich, but what about the rest of America? The fact is that median income has grown more slowly after taxes were lowered for the wealthy. The entire economy also grew more slowly and although that might be due to other factors, supply-sider cannot give evidence that lower taxes on the wealthy boosted their wealth enough to trickle down to help the middle class.

Economists like Greg Mankiw believe that each person’s income roughly represents how much they contribute to society. This is called the marginal-productivity theory of wages. This theory is sometimes useful as a first approximation, but it is clearly inaccurate. For example, CEOs can increase their incomes by making their companies more productive (which is very hard to do) or by squeezing more profits out of their companies for themselves. When income taxes are high, there is less point in playing political games to squeeze more profits away from shareholders and employees because the government would get much of it anyhow. It is impossible to know exactly how much of soaring CEO pay was a reward for higher CEO productivity and how much was a reward for CEO shenanigans with corporate governance, but there is zero evidence that corporations became more productive when their CEOs’ pay soared.

Most people don’t realize that CEO pay peaked in 2000 and then plummeted and has never completely recovered, but again there is no evidence that CEO productivity is lower now than in 2000.

Posted in Public Finance

Supply-Side Economics is NOT a school of economic thought

When I first began teaching economics as a graduate student in the mid 1990s, I noticed that many of the principles-level economics textbooks talked about “Supply-Side Economics” as a school of economics. This was curious to me, because I was studying PhD-level economics and the concept had never come up in any classes or readings. So I did a search of the entire economic journal literature on Jstor for terms like “supply-side economics”, “supply-sider” and “supply-side economist” and I came up with only a handful of hits. They almost exclusively talked about politicians and popular conceptions of economics rather than any kind of academic school of thought.

Although there undoubtedly some academic economists who are sympathetic to supply siders, approximately zero economists have ever been willing to associate with that ideology in their published academic work. A poll by the conservative University of Chicago Graduate School of Business found that zero economists agreed with the supply-side idea that, “A cut in federal income tax rates in the US [in 2012] would raise taxable income enough so that the annual total tax revenue would be higher within five years than without the tax cut.”

Over a third of the economists surveyed in the poll thought that cutting taxes would boost GDP, but that doesn’t mean that they agreed with supply-side economics. In 2012 the unemployment rate was over 8% which is higher than it has ever been since the Great Depression with the exception of the two big oil-shock recessions in 1974 and 1981. During high unemployment, standard Keynesian economics also agrees that tax cuts will boost GDP. The difference between Keynesians and the supply-side politicians is, 1. The Keynesians realize that cutting taxes will increase deficits whereas the supply-siders don’t. And 2. The Keynesians don’t think that cutting taxes will automatically boost real GDP during economic booms when there is already full employment. There is a good probability that a tax cut would boost nominal GDP by raising inflation, but raising inflation is a bad idea at times like that.

Posted in Public Finance

The socialism-prosperity curve.

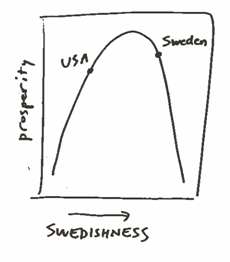
Jordan Ellengerg’s book, How Not To Be Wrong: The Power of Mathematical Thinking  has an entire chapter about how surprisingly difficult it is for people to think in terms of non-linear relationships like the equity-efficiency curve. On page 23, he draws a very similar curve that describes how much government intervention is optimal for a nation. At one end of the curve is communism and the other end is anarchy. He humorously calls it the “Swedishness” curve but what he means by that is government intervention or socialism.

In any case, the left side of the curve should end a lot lower than the right side of the curve because all real examples of anarchy certainly have less prosperity than communism. I’m talking about nation-state size populations rather than tribes or villages that are left alone by other people. Anarchy can work fine for a small group of people as long as they can avoid disputes with bigger or more powerful groups of people. There are many examples of both anarchy and communism with varying outcomes, so it is a gross simplification to represent the curve as a precise line, but even the worst example of communism is probably more prosperous than the average example of anarchy. I’m not sure what the worst example of communism is because there are so many examples: North Korea, Cambodia, etc. I’m not sure what the best example of anarchy is either (Somalia in the 1990s, medieval Iceland, etc.) but all examples of large-group anarchy are all either extremely poor, or extremely short lived. Mass-society anarchy in the 20th century has been much less stable than communism. The worst example of communism might even have a better record of creating prosperity than the best example of anarchy! It is hard to know for certain because there is no government to collect statistics about prosperity under anarchy.

However, there is no doubt that the best example of communism was FAR, FAR better at creating prosperity than the best example of anarchy. The Soviet Union was far better at creating prosperity than any other example of communism and it worked quite well for almost half a century. We all tend to think of it as being a basket case now, but that is historical revisionism. It is easy to forget that the communist Soviet Union was one of the two great superpowers of the 20th century.

The USSR grew quite rapidly for 40 years after the 1917 communist revolution as you can see in this Gapminder graph comparing Russia and the US.

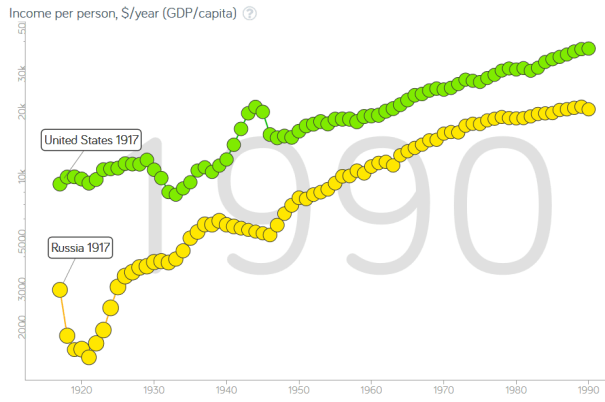
This graph shows the best measure of economic prosperity that we have, GDP/capita, on the vertical axis. It is in log scale because that represents the relative progress between the two nations as the size of the gap between the two lines. The gap narrowed from 1920 until 1939 because Russian growth was faster than US growth until WWII when Russian GDP was artificially suppressed by wartime destruction whereas US GDP was artificially boosted by government production and the gap widened.  WWII was so horrific in Russia that life expectancy dropped to under 16 years which is much worse than conditions on the western front to say nothing of in the US.  US life expectancy actually rose during WWII, perhaps in part because massive wartime spending finally helped the economy recover completely from the Great Depression. After WWII the economic gap between the US and Russia dramatically narrowed as life normalized in the later half of the 1940s and Russia again grew faster than the US. Overall, average Russian growth was faster than US growth until sometime in the 1970s when Russian growth stagnated and the slope of the yellow line levels off.

When capitalist progress collapsed during the Great Depression of the 1930s, the USSR economy kept right on chugging along without any problem with unemployment. That made it look appealing to unemployed workers in the US where unemployment reached 25%. Then it turned what had been a 3rd-rate military power under the Tsars into a superpower on par with the USA and bore the majority of the weight of defeating the Nazis in WWII. It detonated a nuclear bomb only four years after seeing the US drop one on Japan and then launched the space race by putting the first satellite into orbit and the first human in space.  They were also a superpower in international competitions like chess and the Olympics where the USSR usually won the most medals.

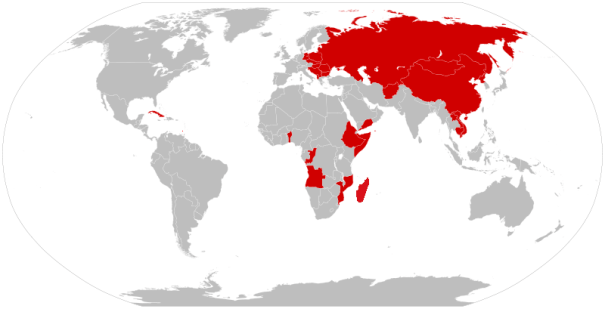
The USSR’s dramatic economic success until the 1970s is what inspired a half century of imitators around the globe. It inspired armed communist insurgencies in about 30 nations around the world. Communism became a particularly attractive model for the former colonies in the “3rd world” whose economies had stagnated in poverty under the capitalist management of the “1st-world” nations of Europe. The USSR was then called the 2nd-world and it had been an economic development miracle in comparison to capitalist colonialism. The fledgling independent governments that the 1st-world nations left in place when they granted independence to their former colonies were largely composed of the same old capitalist elitist that had been so unsuccessful at economic development under colonialism and many of their peoples wanted something different. The fact that many capitalists in the 1st-world were terrified of communism only burnished the appeal of 2nd-world economics in the 3rd world. The map below shows the countries that were officially communist in 1980. Many more nations were run by communists at some other point in history and communist parties have achieved at least partial power many capitalist nations. For example, communists have had some degree of official political power over many European nations to the extent that six European nations have elected representatives of communist parties to the European Parliament.

Oddly, except for the USSR, no other communist nation was particularly successful at growing economic prosperity. China and Vietnam have grown spectacularly since about 1980, and they still claim to be communist, but they achieved economic success by gradually abandoning soviet-style communism and adopting state-directed capitalism in a way that is more like a blend of Singapore and fascist economics than free-market capitalism. Unlike the USSR, their economic success can hardly be ascribed to communism even if they do retain a much larger degree of government ownership and government involvement in business management and planning than in western capitalism.

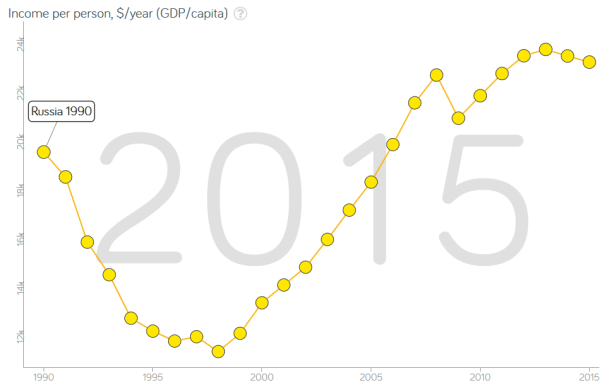
The communist nations of East Asia were not successful economically, but even so, they succeeded militarily in fighting the combined weight of the US and allies to stalemate in Korea and then succeeded in driving the US out of Vietnam. In the 1980s, President Ronald Reagan was convinced that the USSR had surpassed America in military might. Ironically, the USSR’s economy had been stalling at that point and their military was stagnating, but Americans believed Reagan’s fears that the USSR military was ahead of the US and cold war movies like Firefox (1982), The Day After (1983), and Red Dawn (1984) are good illustrations of popular sentiment during the Reagan era. The last big cold-war movie in this genre was The Hunt for Red October which was released in 1990, after the USSR was already disintegrating, but even then Soviet supremacy still felt real enough to make it a blockbuster. To modern eyes, the movie looks like a strange alternate reality because we tend to remember the USSR as a basket case whereas the communists were portrayed in the movie as being terrifyingly super powerful. Although the USSR was already stagnating in the 1980s, the Russian economy did not collapse until the transition to capitalism from 1990 until 1998 as you can see in the Gapminder graph below. Russia didn’t even recover the economic prosperity it had at its peak under communism in 1989 until 2007 and much of that was due to the rise in energy prices bringing it prosperity as one of the world’s biggest oil and gas exporters. Lower oil prices since then (and economic sanctions against its military adventures in Ukraine) have produced another round of economic stagnation since 2008.

Russian life expectancy also plummeted under capitalism and didn’t recover back to its peak under communism until 2012.

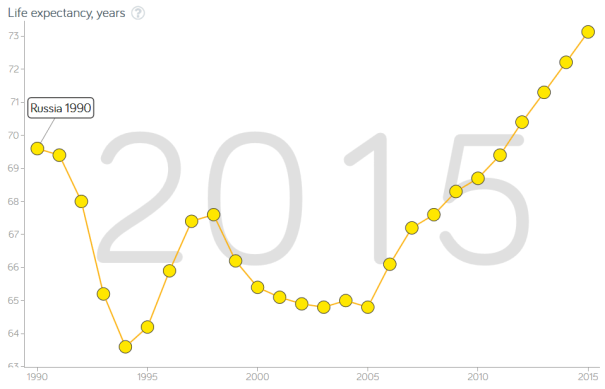
The fact that Russia has done far worse in growing both GDP and life expectancy under capitalism than it did under communism is a good example of the complexities of both kinds of systems. Ellengerg’s book correctly points out that many people today think that there is a linear relationship between capitalism and communism with capitalism being successful at one end of the line and communism being a failure. As the Russian experience demonstrates, this is false. And the opposite of communism is not capitalism, but anarchy. Capitalism is somewhere in the middle between communism and anarchy because capitalism cannot exist without some amount of socialism. Zero socialism is anarchy and capitalism cannot survive for long under anarchy. Capitalism can produce higher prosperity than either communism or anarchy, but multiple different combinations of government and markets can produce similar levels of prosperity from socialist-leaning Sweden and Norway to Singapore to the US. Linear thinkers think the world is like this (in which ‘Swedishness’ is really a measure of socialism again):

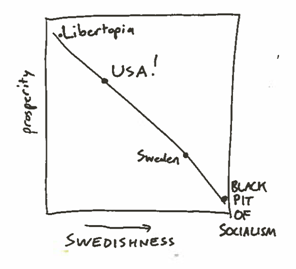
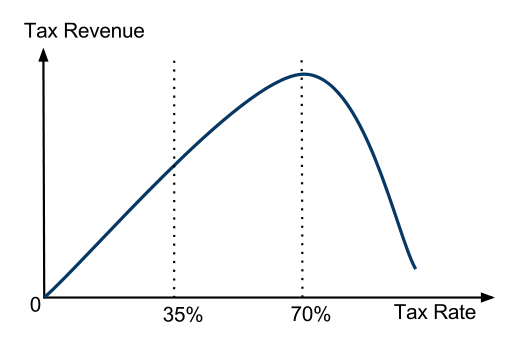
Milton Friedman was easily one of the ten most influential economists of the 20th century and he famously said, “I’m in favor of cutting taxes under any circumstances and for any excuse, for any reason, whenever it’s possible.” Friedman was a meticulous, nuanced thinker in his academic work, but in his popular work, he sometimes promoted sloppy thinking as this quote illustrates. He was a libertarian who said here that he would cut taxes to zero. That would not result in libertarian capitalist utopia, but anarchy. Friedman was an ardent believer in capitalism, not anarchy, and he realized that some taxes are inevitable. Even so, it is so easy to fall into the trap of linear thinking that even Friedman fell into it in his quote which is generally parroted by people with much less nuanced thinking.

Although Friedman’s quote exhibits some sloppy linear thinking, he clearly understood the non-linear relationship between socialism and prosperity. He even helped invent payroll tax withholding for the US government as a way to raise tax revenues more efficiently, so he clearly didn’t advocate for zero taxation in all cases! He just thought that the peak prosperity of capitalism could be achieved with a little less socialism than the Swedish voters want. Although many Americans think that Sweden is socialist, they don’t agree. They have never officially called their economic system socialist and in some ways they are more free-market than the US.

Posted in Development, Inequality, Public Finance

Enter your email address to follow this blog and receive notifications of new posts by email.

Join 75 other subscribers
Blog Archive
Pages