The US Has High Mean Wealth, But Low Median Wealth

Ray Person sent me an article from Money Magazine that compares mean wealth with median wealth which suggests that although the US is one of the wealthiest countries in the world on a per-capita (mean) basis, unfortunately the US is less equal than most rich countries which means that the average American (the median) is poorer than most of the rich nations that we like to compare ourselves with.

“Americans tend to think of their middle class as being the richest in the world, but it turns out, in terms of wealth, they rank fairly low among major industrialized countries,” said Edward Wolff, a New York University economics professor who studies net worth.

Why is there such a big difference between the two measures?

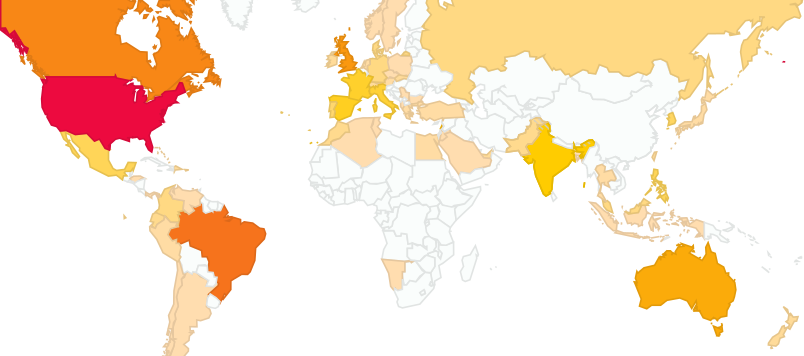
Super rich Americans skew average wealth upwards. The U.S. has 42% of the world’s millionaires, and 49% of those with more than $50 million in assets.

This schism secures us the top rank in one net worth measure — wealth inequality.mean or -median wealth

In the article, Edward Wolff names some interesting theories why the US has the highest wealth inequality.  He points out that high college spending in the US and our unusual home ownership patterns have a big impact on median wealth and America’s weaker safety net means that random events are more likely to wipe out the savings of middle class (and below) Americans.  The median American is likely to go into debt at some point to pay for a health crisis, education, or a period of unemployment.

According to the data, the nation with the highest median wealth in the world is Australia.  Australia does not have a particularly expansive welfare states, but they do have universal healthcare and cheaper university education than the US.  They also have some of the most expensive housing in the world which could hurt median net wealth. Although housing is an important store of wealth for the median, it is also an ongoing living expense so expensive housing hurts living standards, ceteris paribus, and expensive mortgages redistribute net wealth from borrowers to the lenders.

It is odd that Australia has high housing prices when it has very low population density and is a major natural resource exporter.  Australia should have low materials costs for construction.

I’m skeptical of Credit Suisse‘s methodology because they are not open about showing their calculations.  They don’t even clarify if they are showing median individual wealth (which would be most useful in theory) or median household wealth (as the Census typically reports) or median family wealth (which the Fed often uses).  This is an important distinction.  If they are showing median individual wealth, then they should explain how they disentangle household wealth to divide it among individual household members.

As I wrote before, it makes a lot more sense to measure median wealth rather than mean wealth because all financial wealth is a zero-sum game.  All financial wealth, including the financial value of all money, is merely debt and so one person’s financial wealth is merely another person’s debt.  On average, all financial wealth is zero, so there is no point trying to measure mean financial wealth.  But because the distribution of wealth is highly skewed, median financial wealth is always negative.  High financial wealth inequality can only happen by increasing the debt of poorer people and decreasing median financial wealth.

There can only be positive mean wealth in real assets like land, housing, and machines that are expected to generate income, but it is much harder to estimate the value of physical assets than financial assets which is why I am not confident in Credit Suisse’s data.  Physical wealth is the only real net wealth and it can only increase if physical objects become more productive. That can only happen a few different ways:

  1. Population growth increases the marginal utility of physical goods.  Land is an example.  When the population increases, the marginal productivity of land must increase.
  2. Technological improvements increase the productivity of existing bundles of atoms.  For example, the invention of the stone arch made masonry more productive.
  3. Capital formation increases the productivity of existing bundles of atoms.  For example, if we build a lot of stone bridges through much hard work, it will increase wealth by making the existing stone more productive.  The Pons Fabricius bridge in Rome has been in continuous use for over two millennia.  That was a lasting increase in wealth.  The pyramids of Egypt increased wealth for much longer, but they have had a very low payoff relative to the sacrifice they required of the original builders.  They have only increased wealth by increasing the beauty of the view around the Giza plateau which increased the utility of the area due to greater aesthetic value:

4. A tremendous amount of wealth that we all benefit from is commonly owned.  There are the roads, sewers, schools, nonprofits, and infrastructure that does not show up on any household balance sheet but that benefits us all.  There is also the natural capital which sustains life and which is being degraded by pollution and climate change.  That is also neglected by most attempts to measure wealth and it is perhaps the most important form of wealth of all.

Financial innovation rarely increases wealth because it is just ways of shifting around debt and that is a zero-sum game.  Financial innovation only increases real wealth if it has an impact which increases population, technology, or capital formation.

That is all that that I have time to write at the moment, but wealth measurement is a neglected and complicated issue in economics which deserves more work.

Posted in Inequality, Macro, Medianism, Public Finance

A Parable About Efficiency and Equality

Updated Dec 13, 2023

A commentator recently asked how efficiency and equity could both increase at the same time.  I have outlined the idea in previous posts, but I also think a parable is a good way to illustrate the general principle.  Suppose you created policies that created extreme equality for everyone in society.  Then everyone would get exactly the same amount of economic wealth and income.  Everyone knows that wouldn’t work and so nobody has ever proposed to create such a society on Earth.  Not even Jesus.  That is probably because it isn’t really fair for some people to do risky, unpleasant, or difficult work when other people still get the same monetary compensation regardless of the real sacrifices that anyone makes.  Also, there would be zero selfish motivation to be productive because you would get the same income regardless of what you do.  People would only work for altruistic reasons.  That is a significant motivator, but that motivation is also present in fairer societies where people are more fairly compensated for their effort and sacrifice, so less monetary equality will produce more goods (efficiency) than a perfectly equal society.

That is the common textbook parable about the dangers of absolute egalitarianism, but the textbooks neglect to tell the parallel parable about the dangers of excessive inequality.  Absolute inequality would also be an absurd situation that nobody proposes for any society on Earth.  It would be an even worse hell than absolute equality.  The greatest inequality would be a slave society where one person owns everything on earth.  This would be an extremely inefficient system because one guy would not really need billions of slaves and they would be a headache to manage, so he would probably let most of the population of the world starve to death.  Too many people would just get in the way of his adventures.  Like with perfect equality, there is no incentive for people to work because they don’t own anything and won’t be able to keep anything because anything that they try to work with is already owned.  The only way to create incentives to work is for the slaveholder to increase equality.  If the slaveholder doesn’t share some of his food, everyone else will die.  Furthermore, giving food in exchange for work would raise production by motivating people to do more work.  That will increase equality because the slaves will gain some de-facto property rights to the food, and more equality will increase production (efficiency) because slaves will produce more.

For any kind of property rights, you can draw a curve where efficiency is enhanced by greater equality up to a point, but at some point there can be too much equality as drawn on this simple diagram:

2.3 inequality and human capital

For this diagram representing the overall income distribution, I drew the point that maximizes MELI to the right of the efficiency maximizing point because it would be worthwhile to sacrifice some production to be able to increase prosperity for the majority of people.  Nobody knows exactly what the shape of the efficiency-equality curve is, and the curve will be different for different kinds of policies, but it is a general law of economics that both excessive equality and excessive inequality are worse than a golden median.  For example, the curve for different levels of education will maximize efficiency at different levels of inequality.  Pretty much everyone in society should get a primary education, but it would be a waste of resources (and it would make a lot of people miserable) to try to get everyone to earn a PhD.

2.3 inequality and human capital3
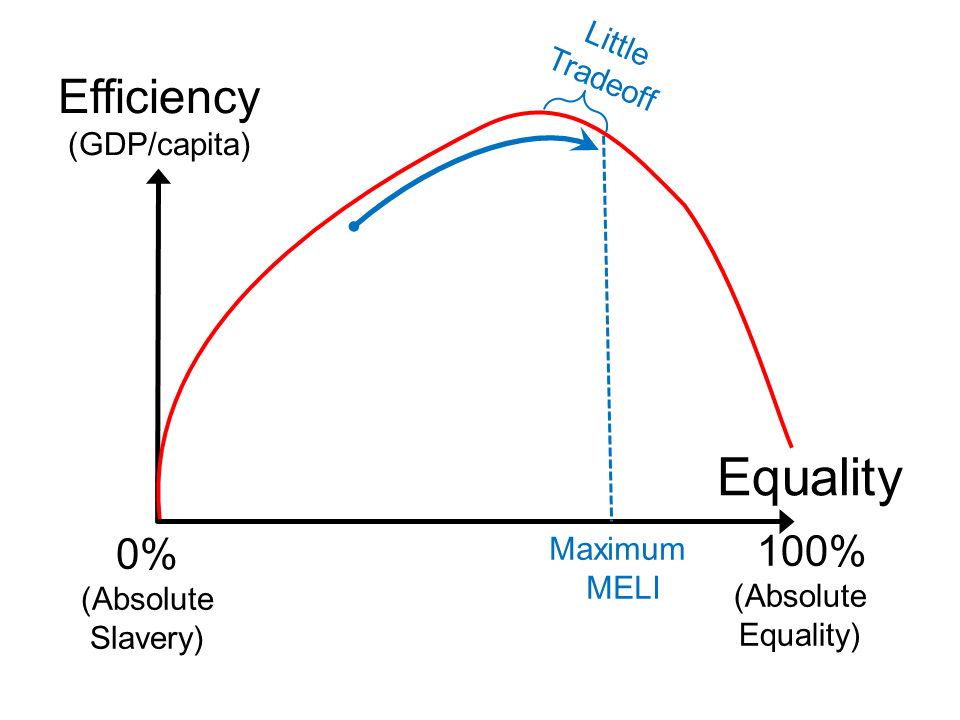
Sweden used to be one of the least equal nations on earth and then the Swedish government changed policies to make Sweden one of the most equal on earth and economic growth soared.

Source: Thomas Piketty

In the above graph, the top 10% and the top 1% can be thought of as a stacked graph where the gap between the blue and the yellow is the wealth of the 90-99th percentile.  The green line is the 40% of the population in the 50-90th percentile (the upper-middle class).  That group gained the most wealth from the top 1% which was the only group that lost its share of national wealth after 1910.

Even though the top 1% lost most of their relative economic status, all classes got richer because economic growth was so enormous that it dramatically increased living standards for all levels of society.

Posted in Inequality, Medianism

Updates About MELI

I added some additional pages about Median Expected Lifetime Income (MELI) to the Medianism FAQ this week:

M1. What is Median Expected Lifetime Income (MELI)?
M2. Why is MELI better than GDP?
M3. Why is MELI better than the United Nations’ Human Development Index (HDI)?
M4. You claim that MELI is better than GDP and the HDR. If MELI is so great, why doesn’t anyone use it?
M5. Why doesn’t anyone care about existing measures of median income?
M6. Why haven’t economists already made the obvious adjustments to median household income that would make the statistic more useful?
M7. What are ways in which MELI is easier to measure than GDP?

Posted in Medianism

MELI Is Better Than The Human Development Index (HDI)

I added a page to the Medianism FAQ to explain why Median Expected Lifetime Income (MELI) is better than the United Nations’ Human Development Index (HDI).  There are four main reasons:

  1. MELI is simpler to understand, more transparent in its formula, and less ad hoc.
  2. MELI has units that give it more empirical meaning.  It is unscientific to discard units of measurement.
  3. MELI is better at correcting for inequality.
  4. MELI eliminates the overemphasis on the education measure that probably adds more noise than signal because of the high measurement error in educational quality and the high correlation between true educational attainment and the other two measures that are also part of the HDI, lifespan and income.
Posted in Medianism

Median Expected Lifetime Income (MELI) vs. GDP

I added another article to the Medianism FAQ: Why Is Median Expected Lifetime Income (MELI) Better Than GDP?

As I was writing it, I noticed a nice infographic at the Social Progress Imperative which tells about the long history of GDP (below).  I like their attempt to replace GDP, but I doubt that it will be any more successful than any of the other attempts due to its complexity.  I’ll explain more of my reasoning in my next FAQ article when I explain why MELI is better than the HDI.
Gdp Timeline Graphic

Posted in Medianism

Happy Anniversary, Medianism.Org

I started this website a year ago and I have written much more content than I expected: 69,000 words, the equivalent of 276 pages.  Although I haven’t gotten as many total hits as I had expected due to a very slow start that seems to have revealed a Google bias, by now I am consistently getting a handful of daily readers even when I don’t post anything new, and more readers whenever I write a new post.  I have enjoyed looking at the different countries on the map that readers come from, 61 different countries in total:  Map

I was flattered to get comments from Scott Sumner, the “blogger who saved the economy,” and links from one of my favorite bloggers, Brad Delong (reposted at the Washington Center for Equitable Growth) as well as Peter Coy at Businessweek and Michael Hiltzik at the LA Times. Thank you to all the readers, commenters, and others who have contributed to this tiny online community.  I am glad that others have enjoyed parts of my work, but I mainly do it for myself because I have had fun working on this.  I write this as a kind of journal, to discover what I think, and to record ideas that I might want to remember later.  Plus, it is a handy place to put some short articles that I might want to assign for my students to read someday.

At this anniversary, it is time to do some restructuring.  Today I changed the home page of www.medianism.org from the blog to a static home page which introduces medianism because a lot of readers seem to be confused about what medianism is.  Now the main blog page is at medianism.org/blog/.  This month I will be working on pages for a Medianism FAQ to explain more of the core ideas of medianism rather than writing as much about general economics topics on the blog .  I just posted the first essay for the FAQ: What is Mutilitarianism?  I’ll post links to new FAQ essays here on the blog, but the articles themselves will be pages in the FAQ directory rather than located in the blog.

Posted in Blogging, Medianism

5 Times More Economists Support Raising the Minimum Wage Than Oppose It

Economics textbooks leave most students with the distinctive impression that raising the minimum wage creates a market failure and only creates unemployment because that is the simplest story you can tell using the most revered tool in economics: the supply and demand graph.  Many of my students probably think that I oppose the minimum wage based on this powerful, but overly simplistic model.  As I wrote a month ago, I think there are better ways to reduce inequality, but they are less politically feasible than the minimum wage, so I support raising the minimum wage.  And most PhD economists agree with me.

The University Of Chicago economics department is famously conservative and free-market, and within the University of Chicago, the Booth Business School is probably the most free-market.  This group sponsored a survey of elite economists that found that almost five times more economists support raising the minimum wage than lowering it.

min wageThis is unsurprising to me from my conversations with other economists.  What is more interesting is that over a third of these economists either don’t know or don’t care about this question.  This is probably partly because this is a poll of elite economists and many elites don’t care enough about inequality to learn about the effects of the minimum wage.  Plus elite academics often get so focused upon their areas of specialty that they ignore most of the rest of what is going on in economics research outside of their own narrow field.  That is one of the reasons that elite economists sometimes make stupid public mistakes.

Posted in Medianism, Public Finance

Enter your email address to follow this blog and receive notifications of new posts by email.

Join 75 other subscribers
Blog Archive
Pages