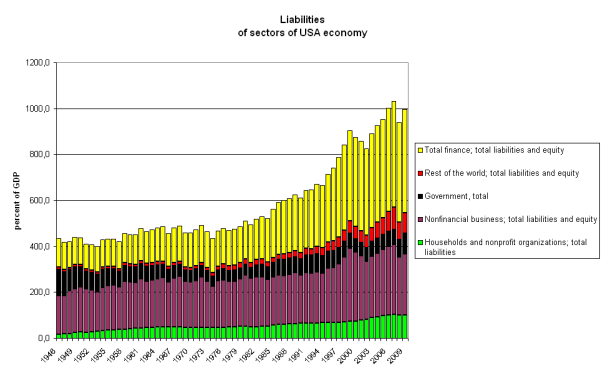
There are various macroeconomic theories that claim recessions are caused by changes in debt. These theories make intuitive sense. For example, in Minsky‘s version, investors get overly speculative during periods of economic stability and take greater and greater risk in lending (investing) their money which fuels speculative financial bubbles. When the bubbles pop, the investors stop lending their money and the debtors must pay it back. This causes a balance-sheet recession in which most people have greater debts than assets (on their ‘balance sheet’) and so they must spend less to pay back their debts. This is also sometimes known as the debt deflation theory of recession. In the debt deflation theory of recession, people try to deflate (or reduce) their debts which causes price deflation as the aggregate demand for goods and services falls.
Similarly, as John Cassidy says in his book, How Markets Fail, the housing bubble was caused by an explosion of debt in the US. From 2002 to 2006, total debt outstanding increased 42%! “The increase in debt amounted to about $43,000 for every person in the country, including children and senior citizens.” (p.223) But that also means that someone else was lending that much money to the debtors, so the net debt did not change.
The paradox of debt is that net debt is always zero for a group in total. One person’s debt is always equal to another person’s asset. So the total net debt of the world is always exactly zero. The US can borrow money from foreigners, but net US foreign debt is fairly modest because Americans also lend a lot of money to foreigners. Most US borrowers get their money from US lenders. From this perspective, there can never be a general increase in debt. It is always zero! But then how do we get measurements like the following graph from Cassidy?

I have no idea! Unfortunately, these kinds of graphs are rarely accompanied by a good explanation of what they are trying to measure.
The Fed’s flow of funds accounts shows the total amount of debt and the total amount of financial assets in the nation and they are approximately equal (plus the measurement error). Here is their measure of financial assets:

Which is almost exactly equal to their measure of debt:

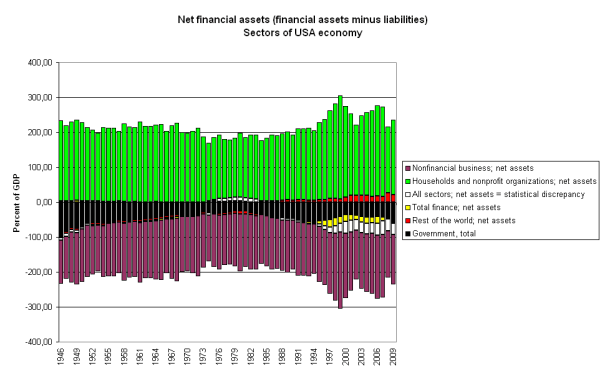
Finally, you can see in the top graph that the green bars representing the financial assets of households (& nonprofits like foundations and universities) is much larger than the green bars representing their debts in the second graph. Subtracting assets from debts for each sector yields their net savings which is mainly owned by households and the following graph shows net savings equals net debts which are mostly owed by US businesses and government.

The yellow bars are the banks (and related financial firms) which normally have assets that almost exactly equal their debts, but which took on extra net debt in the 1990s which disappeared during the financial crisis in 2007. At the same time, the white error bars expanded and have yet to shrink. I’d love to learn how/why the banks took on a lot of excess debt in the 1990s and why the Fed’s flow of funds accounts developed a big, persistant measurement error during exactly the same period.
The only way there can be an increase in total debt (which Cassidy purports to show) is if we only focus on the debts of one particular group while ignoring the increased assets of the lenders. But this is completely arbitrary. If we want a better measure of debt we have to examine the distribution of assets and debts. One possibility is to begin measuring median household net debt. Because the wealthy are the primary net savers in every country, and the middle class is the primary borrower, the median net debt could be a much more useful macroeconomic indicator than the data in Cassidy’s graph which does nothing to explain 90% of the recessions that are shaded on the graph.
The standard Keynesian explanation for recessions is all about the distribution of financial resources. A recession is caused by excess savings (or ‘hoardings‘) that aren’t being loaned out and spent. Very few people near the median income and below have net savings at all, much less excess savings, but there are times when most people all try to save more (or payoff debt which is the same thing). When everyone tries to increase savings at the same time, it must cause excess savings (or ‘hoardings’) which must cause a recession.
Every dollar saved represents a debt that someone else owes. When someone gives you goods or services in exchange for your savings, they are paying society’s debt to you. Although some savings is hoarded, most savings is loaned out again (as debt) to someone else. Because savings are incredibly unequally distributed, that means that only a fairly small number of wealthy elites can have net financial savings. Most people have net financial debts. Many people also have physical assets (like housing or a share of a business) that could be sold to pay off their financial debts, but if we only look at the distribution of claims over financial assets rather than real assets, the vast majority of people in every society are financial debtors who owe a few wealthy elites.
Whereas everyone in the world could have an equal share of real assets like land, a financial asset is only created by creating debt and so financial assets can never be equally distributed. Someone has to owe someone else.
A better measure of debt would explicitly address the distribution of debt. Median debt/GDP is one such measure, but nobody will really know exactly how useful it is until we start collecting the data. There has hardly been any attempt to measure the distribution of assets and liabilities for households. It could be important because, as Robert Schiller says, inequality leads to debt which could contribute to economic crisis:
A 2015 study published in The American Economic Review by Michael Kumhof of the Bank of England, Romain Rancière of the International Monetary Fund and Pablo Winant of the Bank of England found that both the Great Depression of the 1930s and the Great Recession of 2007-9 had their origins, in part, in rising inequality.
Both were accompanied by increases in borrowing by low- to middle-income people, who tried to maintain their standards of living. High-income people, described by the authors as desiring wealth for its own sake, did the lending.
That is just one study. More research is needed.


[…] One person’s debt is always another person’s savings, so if debt is bad, then savings is bad. Most people think of their checking account as an asset, but it is also a debt that a bank owes to you. A bond is a debt that an organization owes to the bond owner. Some financial assets include physical collateral which is not a financial instrument, but a claim of ownership. For example, a mortgage is a debt that a home buyer owes to a bank with the house as collateral. Some people see a mortgage as a form of home ownership, but the payment contract is clearly a debt. A share of corporate stock is usually seen as ownership of a piece of a company, but it is closer to a form of debt than a form of ownership. It is a collateralized perpetual bond with a variable repayment rate that is tied to the profitability of the company. Unless you own a big enough fraction of a company’s stock to have a real say in how it is run, the company’s CEO and board of directors have much more ownership power than you and you are more like a lender. […]