The connection between exceptionally low US social spending and exceptionally high healthcare spending.

Social spending is a ‘normal good‘ which means that richer countries (and richer people) spend more money on it.  One of the odd facts about the United States is that we spend a lot more of our income on healthcare than any other country on earth, but we spend a lot less on other social services than most rich countries.  Healthcare and other social spending are rarely added together, but healthcare is really a form of social spending.  In fact, it is the biggest single category of social spending in most countries. In 2011, Elizabeth H. Bradley et al. (Benjamin R Elkins, Jeph Herrin, & Brian Elbel) published the first examination of how both forms of social spending add up to influence health outcomes and here is their graph. Notice that the US spends so much more on healthcare (the dark part of the line at the bottom), that even though the US spends less on other social spending, in total the US has larger than average combined social spending compared to most nations.

health vs social spending

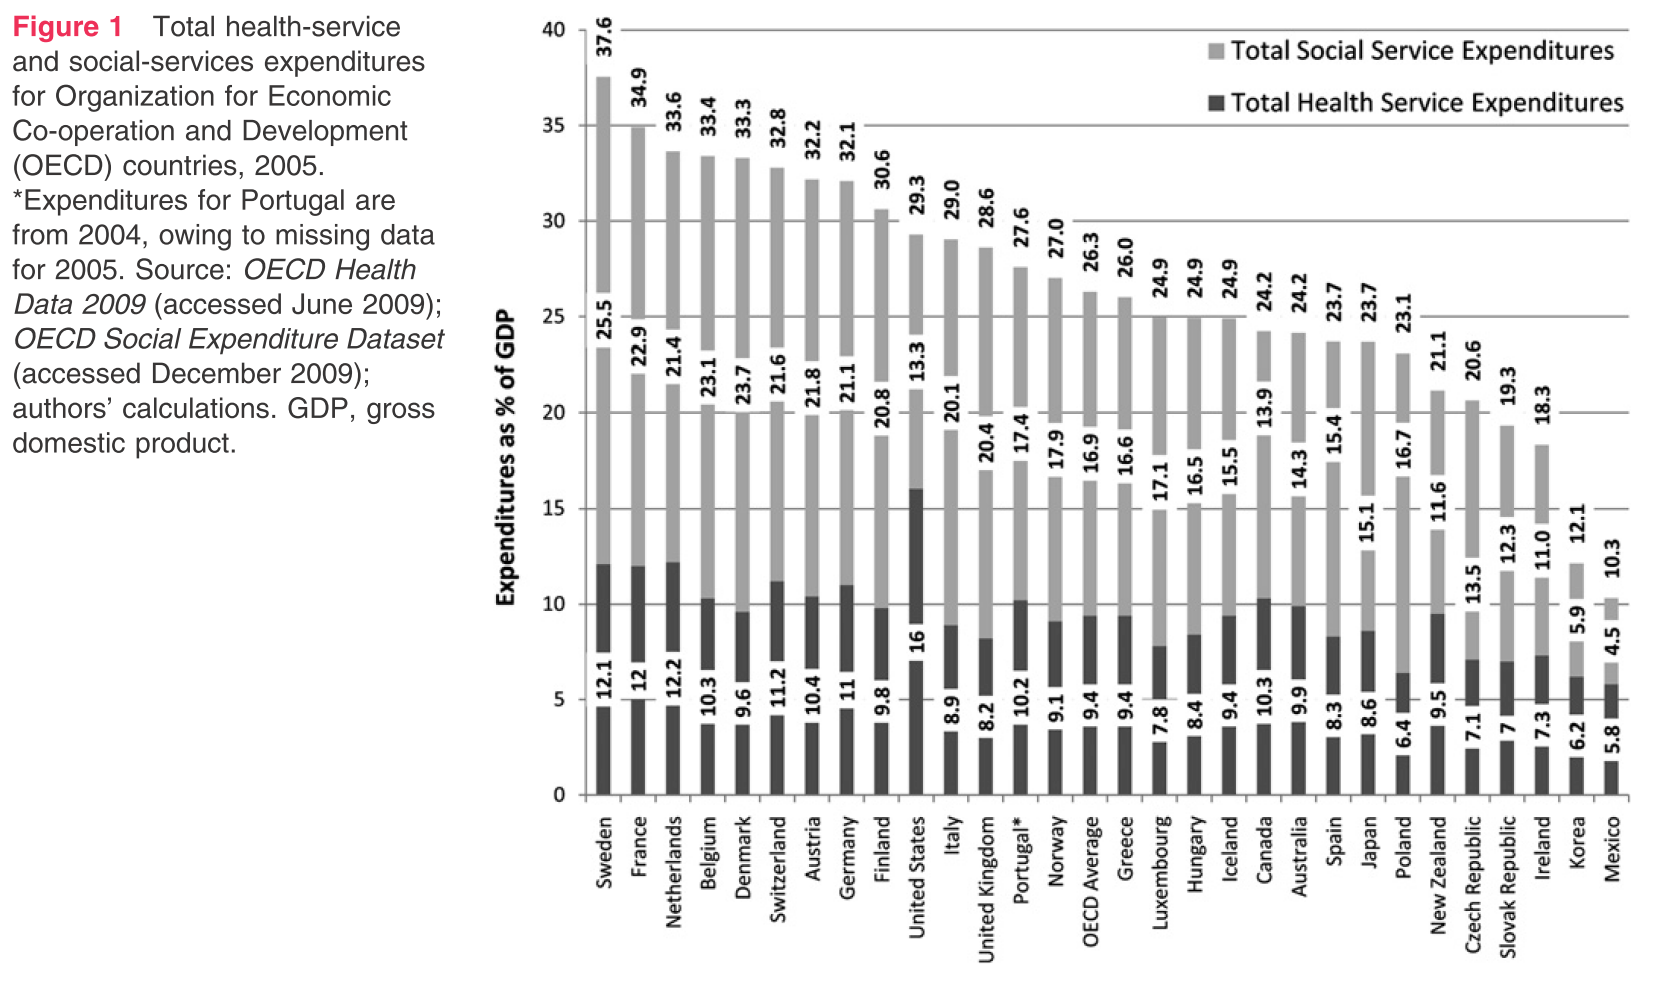
The US spends only 92 cents on non-health social services per dollar of healthcare spending whereas the average in other OECD nations is more than $2.  Bradley et al. argue that countries like the US should divert more expenditures away from healthcare towards

…broader domains of social policy, such as unemployment, housing and education,… to accomplish the improvements in health envisioned by advocates of healthcare reform.

Elizabeth Bradley followed up by writing a book, The American Health Care Paradox, which was reviewed by Allan Joseph:

In terms of total spending that affects health, America’s actually right in the middle of the [OECD]—implying a gross misallocation of spending: too much spending in health services, and too little in social services. This is the core assertion of the book: implicating the social determinants of health as a central player in the problems of American healthcare.

Bradley and Taylor leverage this finding to create a quality book. They outline the historical development of the social-service and health-service sector, show that they split early in American history, unlike in other countries, which see them as two facets of the same system. That’s helpful information to have, if only to understand that the gulf between the two worlds is wide, and it’s not a simple task to shift spending from health services to social services.

…Take, for example, the story of Barry, a business executive whose startups went under:

As this business closed its doors in the same year it opened, Barry found himself financially and emotionally depleted. He was without a permanent home, unable to pay rent, and feeling like a failure…Barry is now morbidly obese, at six feet tall and 320 pounds, a binge eater, and prediabetic. He is uninsured and lives in temporary housing. He suffers from frequent leg cramps, periodic chest pain and despondency, and is in the early stages of developing some of the costliest disease to treat, including clinical depression, heart disease, and diabetes. (p. 53)

Barry was a healthy entrepreneur who risked all his money on a business and when the business failed, he found himself homeless and uninsured.  His health rapidly deteriorated due to stress, poor diet, and depression.  Many people like Barry wait to get medical help until a crisis forces them to go to an emergency room.  Barry would undoubtedly qualify for Medicaid which could provide relatively inexpensive preventative care to treat his diabetes and heart disease, but it is not automatic, and many people in his situation do not find out that they qualify until a hospital emergency room signs them up after a health crisis.

A MillBank Quarterly investigation gave another case where social service spending was much cheaper than healthcare spending:

one organization learned that a woman in its care had visited the emergency room approximately 20 times in 1 month. The organization discovered that because she did not have transportation to her primary care doctor, she was using emergency services to meet her health needs. But when the team bought her a monthly bus ticket, her visits to the emergency room stopped. How many other people like her have similar transportation issues?

The woman had health insurance, but no transportation to get to her primary doctor. A monthly bus pass is MUCH cheaper and more effective than almost daily ER visits and it was cheaper for the hospital to buy her a bus pass than to keep providing almost daily ER services to treat crises that would be easily prevented.  But even if the woman had no health insurance, it would still be cheaper to give her a bus pass and free outpatient checkups because Ronald Reagan created the legal entitlement that all people on American soil have a right to unlimited ER care at American hospitals.  That entitlement makes it cheaper to end homelessness by providing free housing than to let homeless people clog our emergency rooms.

The paradox of American social service spending is that we will give millions of dollars to anyone (regardless of citizenship or ability to pay) who shows up to an emergency room in a health crisis, but we only give the dollars in the form of health spending.  We are happy to spend millions of dollars on a high-tech premature birth for anyone, but once the baby is out of the hospital, we are less generous than most rich nations with helping all babies get good nutrition, shelter, daycare, and transportation to get vaccinations.  Bradley et al. argue that stingy social spending helps explain why the US has higher infant and maternal mortality than other rich nations despite the US’s much greater expenditures on healthcare.

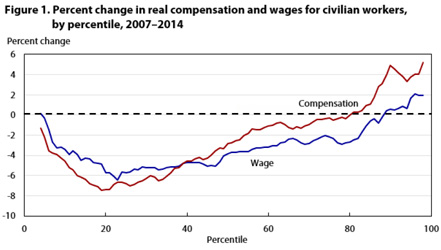
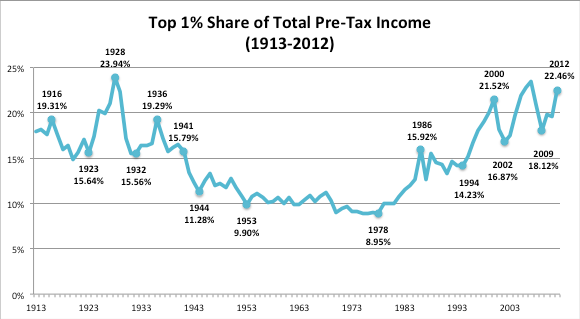
Low social spending also helps explain why the US has higher inequality than any other rich nation.  Nobel laureate Angus Deaton wrote a famous work showing that middle-aged white Americans are dying earlier than in the past.  Little of the reason is due to healthcare.  It is mostly due to rising inequality which is creating more stress for white Americans than for minority groups whose recent history has seen bigger improvements relative to the lives of their parents.

Michael Marmot also has a new book, The Health Gap which makes a similar argument.

If you look at the probability that a 15-year-old will not survive to 60 in the US, it’s 13 percent. The US ranks 50th out of the 194 member countries of the World Health Organization on this measure, which means there are 49 other countries where a 15-year-old has a better survival chance than in the US. This is a country that spends far, far more on health care than any other country.

But this is not a health care issue. If you look at the causes of that premature mortality in the new study — it’s alcohol- and drug-related poisonings, suicide, other alcohol-related deaths, and external causes of death, and by that we mean homicide, violence, traffic pressures, and the like. So people don’t die of drug-related poisonings because of a lack of medical care; they die because they are taking drugs and/or committing suicide.

…The lower people are in the social hierarchy, the more likely they are to be obese, to be less physically active, to smoke, to suffer the consequences of alcohol. The social environment impacts on health by conditioning people’s behaviors. People under stress turn to alcohol, drugs, and violence because of that stress. It’s not very mysterious that people do that.

Marmot argues that reducing inequality will increase health.  But reducing inequal access to healthcare would both reduce inequality and directly boost life expectancy by reducing the deaths that do result from inadequate healthcare.

Posted in Health

80% of Americans have not recovered from the recession.

The Bureau of Labor Statistics has a chart showing that 80% of Americans have not recovered from the recession as of the latest annual data (2014):

bls compensation 2007 2014


Note that compensation rose a lot more than wages for most people. The main reason for higher elite household compensation is because of their investment earnings. Richer people aren’t generally earning more by working.  The main reason they are earning more now is because their property is earning higher dividends, rents, and capital gains.

Whereas the graph shows that median annual compensation was down by over 3% in 2014, FRED shows that real mean compensation had already surpassed pre-recession levels in 2014 because elites had seen their compensation rise so much:

real gdp per capita


Posted in Macro, Medianism

The median American household can barely afford a $400 emergency.

According to a Fed report released in May, 53% of American households could raise $400 to cover a financial emergency without selling property or paying the interest burden of borrowing money for more than a month.  That is a bit better than last year’s survey, but the median American still doesn’t have much financial padding.  afford to pay 400Surprisingly, even a quarter of households with incomes that are greater than $100,000 (about double the median income) lack emergency funds that could cover $400 for a month without borrowing.

Posted in Medianism

Happiness Statistics Need The Median

I am taking students to Columbia next year and so I saw that it was rated the happiest country in the world according to Gallup polls a couple years ago and is #2 in the current ranking.  This is surprising given the seemingly huge social problems like the long-festering civil war funded by drug cartels in Columbia, but many Latin American countries rate themselves as very happy despite having more obvious social problems than the richer countries of the OECD.  In addition to lower incomes, they suffer lower longevity, more corruption, less educational attainment and higher economic inequality.

Oddly Gallup uses the mean happiness score rather than the median happiness score to measure how happy a group of people are.  This is bad methodology since happiness is not cardinally measurable.  They should use median happiness.

The UN’s World Happiness Report ranks Columbia and other Latin American nations as less happy than the rich OECD nations because it uses a different Gallup poll of happiness data: evaluation vs experience.  Latin Americans tend to rate their life experience higher than people in rich countries whereas richer people tend to evaluate their lives as better overall than poorer people.

The five positive experiences include feeling well-rested, laughing and smiling, enjoyment, feeling respected and learning or doing something interesting; the five negative experiences include stress, sadness, physical pain, worry and anger. The items are grouped into index scores known as the Positive Experience Index and the Negative Experience Index.

People in rich countries don’t feel like they rest, laugh, smile, enjoy life and do interesting things as much as lower income Latin Americans, but rich countries do rate their lives as better.  The life experience measure is a bit more like first-person perspective whereas life evaluation is a bit like looking at life from an out-of-body, third-person perspective.  The World Happiness report prefers ‘life experience’ as a measure of happiness because it is highly correlated with mean income, but that actually makes me more suspicious of the measure.  Mean income should not have as much effect on life evaluation as median income.  For example, the 2013 World Happiness Report notes that the Easterlin paradox is the fact that mean happiness has not risen along with mean US income even though richer Americans report that they are happier than poorer Americans in every given year.

The World Happiness Report suggests that the Easterlin paradox could be explained by the fact that income is not measured property, but they miss the big reason why income has been mismeasured in the US since the 1970s: rising inequality.  We should use median income rather than mean income.  Since 1975, real per-capita mean income has doubled in the US but real median income has been stagnant. No wonder the happiness measures have not risen with mean income. Most people are not earning higher incomes. A small fraction of the population has been getting richer and pulling up the average incomes but most of us are not earning more and so why would the happiness of the masses be correlated with the rise in incomes of the elites?

Unfortunately, nobody has bothered to see how happiness is related to median individual income, but that would be much more important as a measure of group wellbeing than mean income.

Posted in Medianism

GDP Was Designed For Warfare Not Welfare

When intellectuals first began to think about economics, they tended to think about the interests of the elites who controlled the government.  That is how economics got its name back in the 16th century.

The term economics comes from the Ancient Greek οἰκονομία from οἶκος (oikos, “house”) and νόμος (nomos, “custom” or “law”), hence “rules of the house (hold for good management)”.

The elites who were developing economics named it for the study of how to manage the royal household’s affairs.  Under monarchy, the royal household’s affairs were the affairs of the nation.  One of the early goals of this national management was to measure what the royal household was producing.  There are several ways to account for national income and production, but the dominant measure since WWII has been Gross Domestic Product or GDP.

Diane Coyle recently wrote an excellent book entitled, GDP: A Brief But Affectionate History.  The book basically gives three motivations why people have wanted to produce a national income (GDP) statistic.

  1. To measure welfare
  2. To understand and deal with the Great Depression (and Keynesian macroeconomics).
  3. To manage national economic resources for warfare.

However, Coyle stresses that the last motive was the real impetus behind spending millions of dollars hiring droves of statisticians and economists to finally develop the fairly precise measurement that became GDP.  She traces the martial motivation for GDP measurement back to the 1665.

In 1665, a British scientist and official, William Petty, produced estimates of the income and expenditure, population, land, and other assets of England and Wales, with the aim of assessing the country’s resources to fight a conflict and finance it through taxes… Petty wanted to prove not only that the country could bear a higher burden of taxes but also that it was capable of taking on its powerful neighbors Holland and France. There was no need for it to win more land or increase the size of the population to ensure victory, because the available land capital and labor could be used to better effect.

…Another early set of estimates, by Charles Davenant in 1695, had the title, An Essay Upon The Ways And Means Of Supplying The War, making his aim perfectly clear. The word statistics has the same origin as state, and originally referred to the collection of figures concerning the state, specifically taxes. It proved to be a major advantage for England to have consolidated national income statistics, enabling calculations about the scope for increased output and tax revenues, when its larger and seemingly more powerful neighbor France lacked such information. (p. 8)

There have been many disparate attempts to measure national income over the centuries, but more resources have been devoted to measures that could be used for accounting for war resources.  For example, Adam Smith’s influential conceptualization of national income in The Wealth of Nations (1776) excluded money spent on warfare because it is unproductive and Smith was more interested in measuring material welfare.  Smith considered services to be an intermediate good that did not directly contribute to the stock of measurable wealth.  Smith only considered physical goods to be real wealth and he did not think that services directly produce anything except to the extent that they ultimately contributed to the production of physical goods.  Because the government mostly produces services, government activity was also generally excluded from his conceptualization.  This idea was later adopted by Karl Marx and the Soviet Union which did not count services in its main national income statistics.  GDP rejects this idea and includes services including those produced by government (which mainly produces services).

Simon Kuznets received a Nobel Prize for his efforts as one of the founders of modern GDP.  In the early 1930s, Franklin Delano Roosevelt began funding Kuznets’ efforts to measure national income because Roosevelt wanted to get a clearer understanding of the Great Depression.  At the same time and for similar reasons, Colin Clark was funded by the British government to develop similar statistics on the other side of the Atlantic.  Both of these economists were motivated by wanting to measure the changes in national welfare during the Great Depression.

Simon Kuznets… was keen to develop a measure of economic welfare. But the demands of wartime meant his ambition was overtaken by the need to measure production and productive capacity, in order to use scarce material resources and labor as efficiently as possible” (p. 91)

…”[Kuznets] argued that Commerce’s method [of including government military expenditure] tautologically ensured that fiscal spending would increase measured economic growth regardless of whether it actually benefited individuals’ economic welfare.” In the policy tussle in Washington, Kuznets lost and wartime real-politik won. (p.16)

…An official US history of the national income accounts describes it this way:

Before GNP [gross national product] was made available, projected defense expenditures were sometimes erroneously subtracted from projected national income, producing a residual that was interpreted as the amount of production left for non-war goods and services… The assessment was overly grim because national income fell short of the total market value of goods and services produced, of which defense spending was a component… By including all government purchases as part of national Products, the GNP statistics established the role of national government in the economy as that of an ultimate consumer, that is as a purchase of goods and services for final use.

…This decision [to include government spending] was a turning point in the measurement of national income, and it meant that GNP (or later GDP) would be a concept strikingly different from the way the economy had been thought about from the dawn of modern industrial growth in the early 18th century until the early 20th century.  For two centuries “the economy” was the private sector. Government played a small role in economic life and featured mainly because it looked to raise taxes to pay for wars.

… By the time the wartime economists developed the modern concept of GDP, government was already a far greater presence than it had been. Subtracting defense spending from the older conception of national income would have wrongly given the impression that the war effort was going to involve a huge sacrifice in private consumer spending… (pp. 15-16)

In reality, the wars DID ‘involve a huge sacrifice in private consumer spending.’ The governments that created GDP measures wanted to hide the sacrifice and so they made it a positive in the national income statistics.  The leadership understood the psychological power of measurement. They promoted a measurement methodology that made war spending look good.

Coyle also shows how the U.K.’s efforts to develop GDP were motivated by the war effort too.

Keynes… fulminated [in his 1940 pamphlet How To Pay For The War]  about the inadequacy of the statistics available to him for calculating what the U.K. economy could produce with the available resources, what would be required for mobilization and conflict, what would be left for her for people to consume – and how much their living standards might need to fall. Planning for the war effort in particular needed much better statistics on how much was produced by individual industries, using what materials…

The motivating force of being at war should not be underestimated. Wesley C. Mitchell, the director of the National Bureau of Economic Research, said: “Only those who had a personal share in the economic mobilization for war could realize in how many ways and how much estimates of national income… facilitated the World War II effort.

Most people realize that GDP is used 1. as a measure of welfare and 2. for understanding recessions and economic growth (the raison d’être of macroeconomics).  These are the two main contemporary uses of GDP. But Coyle documents that a third use was probably a bigger reason for developing GDP: to help manage the economics of the war effort.

No wonder GDP is such a bad measure of welfare.  That was not what motivated the huge investment that went into developing it.  Many academics, from Adam Smith to Arthur Pigou to Simon Kuznets and Colin Clark had wanted to create a statistic to measure economic welfare.  Kuznets and Clark had initially worked on creating an economic welfare statistic before the war, but the realpolitik of WWII overruled their initial motivations and resulted in them producing GDP instead.

Once WWII was over, the cold war immediately began which maintained the wartime impetus for tracking economic production.  GDP also came to be the main macroeconomic performance and welfare measure, and it works fairly well for macroeconomics, but no economist would have created it as a welfare measure if that had been their primary aim.  In the beginning I listed welfare as the first use of GDP and warfare as the third because that is how the statistic is used today.  However warfare was the most important reason for developing the statistic and welfare the least.  That helps explain why it is such a bad welfare measure.

Note: The US actually used GNP rather than GDP until 1991, but the two measures are so similar for the US that I have treated them as synonyms.  The difference between the two has never been more than a couple percent in US history as you can see in a graph of both at FRED.

Posted in Macro, Medianism

Is your family earning twice as much as your parents were 40 years ago (in real dollars)? You should be.

FRED data shows that real per-capita income in the US has doubled since 1975 even despite the financial crisis of 2008.

gdp doubled in 40 years

Unfortunately, this income growth mainly went to the top 10% richest Americans.  Median family income was stagnant from the mid 1970s onwards as shown in this graph from the EPI.

real median family incomeMore than ninety percent of Americans cannot say that they are twice as rich as their parents were 40 years ago in real dollars because this is also the big period of increased inequality in the past century as shown by this graph from Inequality.org:

GIMP-Top-1p-Share-of-Total-PTIFrom the 1930s to the 1970s, inequality dropped and real middle-class incomes soared.  From the 1970s until now, the real median income has been stagnant whereas the top 1% richest Americans’ incomes has soared.  And median household income would have fallen if not for the increased number of hours worked per family.  For example, stagnant wages over the past 40 years helped push families to rely upon daycare so that both parents could work.

GIMP-Real-Average-Hourly-WagesGraph Source: Economic Policy Institute, “Wages and Compensation Stagnating,” 2011, based on Bureau of Labor Statistics data. Figures are for production and non-supervisory workers. (Inequality.org)

Posted in Macro, Medianism

Elites are more important than everyone else because much of our wellbeing depends on them.

There is vast difference between the lives of ordinary people north of the Rio Grande river versus the people to the south.  There are even greater differences between the lives of people across other arbitrary political borders like between North and South Korea which can even be seen from outer space at night due to the difference in light output.  The difference is NOT due to culture or geography because these are quite similar in the two Koreas and when people in Mexico migrate across the border to the US, they bring their culture with them and still become much richer than they would have been if they had stayed home.  The culture and geography on the two sides of the US-Mexico border is approximately the same and yet the poorest region of the US side of the border is richer than the richest region on the Mexican side of the border.

US-Mexico Border HDI(2009 UN HDR, p.10)

Both sides of this arbitrary line are racially and culturally very similar.  They eat the same kinds of foods and listen to the same kinds of music and speak the same kinds of languages.  The big difference in peoples’ lives from nation to nation is due to differences in governance.  Obviously Mexico has been ruled by a relatively small group of political elites for most of its history.  Although Mexico began a stable period of rule by elected officials in 1929, its government was controlled by a single political party until 2000.  Voters never had any real choice because a murky selectorate of elites party insiders always held the real power and decided who should be on the ballot.  If the party decided that it wanted the voters to elect Jose, then it would pick someone just like Jose and give the voters a ‘choice’ between two hand-picked candidates who both would satisfy the party’s desire to get someone like Jose.  Even today Mexican democracy is still bad at responding to the will of the majority of Mexicans according to every international ranking.

Although the US has a much better democracy than Mexico, research by Martin Gilens and Benjamin Page has found that “economic elites and organized groups representing business interests have substantial independent impacts on U.S. government policy, while average citizens and mass-based interest groups have little or no independent influence.”  The rich have more influence because they are the selectorate that determines who is on the ballot in the US too.

US voters will only have a real choice between two candidates for president.  Nobody else has any chance at all to become president.  Liberals will probably have to vote for Hillary Clinton (barring something unexpected) or they might as well not vote and conservatives will have to vote for whoever the Republican party puts on the ballot or they might as well not vote.  That is it.  But at least it is a real choice unlike in Mexico under 70 years of one-party “democracy.”

But we haven’t had any primary elections to decide that Hillary will be the Democratic candidate.  Who decided that she is The One?  The answer is the Democratic party and media elites.  They have decided that four candidates could be considered, but that Hillary is the most serious candidate.  The media and party elites are mostly in the top 2% wealthiest Americans.  Anyone with money can become a party elite, because all you have to do is donate a lot of money to become part of the selectorate.  The more resources you donate, the bigger your influence will be.

The Republican elites are much less sure about who to select as their candidate.  When Ted Cruz launched his presidential campaign in March 2015, there were thousands of news reports that breathlessly announced that Ted Cruz Becomes First Republican To Announce Presidential Candidacy!  But he wasn’t the first official candidate at all.  Cruz was actually only the 194th candidate to officially file with the FEC.  The 194 people who officially filed earlier than Cruz were ignored by the media because none of the elite party donors backed any of them.

This is sometimes called the invisible primary; when party elites pick a nominee before anyone votes.  Republican elites are unusually divided this year.  They usually settle into just a few factions which only allow a handful of candidates to really enter the primary, and this year so far the party is in more disarray than I have ever seen with more numerous candidates that the media has dubbed ‘serious’ and no frontrunner. 

This selection process is just one of many reasons why US democracy ignores the interests of middle-class Americans in favor of elite Americans and special interest groups.  That is why the ideology of the elites matter so much.  It was US elites who created compulsory universal education in the US back in the 1800s.  They forced the masses to pay taxes for schools and then they forced all kids to go to school.  The US business community wanted the schools to help manufacture better workers for their stores and factories.  And it worked out great for the workers.  That was one of the key policies that helped America become the richest country on earth.

Today elite opinion is diverging from mass opinion and I am less sanguine about whether US elites will create policies that help the interests of American workers.  Elites are much less dependent upon American workers in today’s more globalized era.   Below are a couple of graphs from David Roberts and Javier Zarracina that show how different the top 1% are from the rest of us:

elite interests

elite interests 2Back in the 1800s when the elites forced ordinary Americans to go to school, it worked out pretty well for all of us because it resulted in a big drop in inequality and increased productivity.  Today according to the above graph, US elites seem to generally favor policies that will increase inequality and could thereby cause productivity to fall.  The above graph is not showing a partisan divide.  It is a class divide.  Elites control both parties and that is why Washington enacts policies that satisfy the median elite rather than the median American.

Posted in Inequality, Macro, Medianism

Enter your email address to follow this blog and receive notifications of new posts by email.

Join 75 other subscribers
Blog Archive
Pages