Why we should abolish the national minimum wage

Updated 4/12/2018

Arindrajit Dube wrote a paper in 2004 that explains several ways that the minimum wage is flawed in the US, including:

  1. The minimum wage is too low.
  2. It isn’t adjusted for inflation.
  3. It isn’t adjusted for local cost of living and labor market conditions.  In some places with high wages and costs (like Aspen, Colorado) it is laughably low.

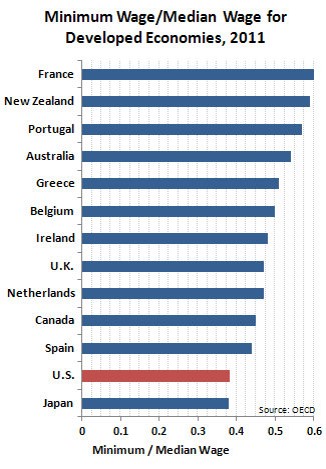
Dube has a better way.  He proposes to set the local minimum wage at half the local median wage.  That would automatically adjust the minimum wage to the local labor market and help keep it adjusted for inflation.  It would also raise the real value of the minimum wage up to the level where it was in the US in the 1960s and 70s and closer to the international average ratio of minimum-to-median in other OECD nations.

Jared Bernstein created a graph showing the effect of a proposal like this in a few regions of the US:

min wage regions

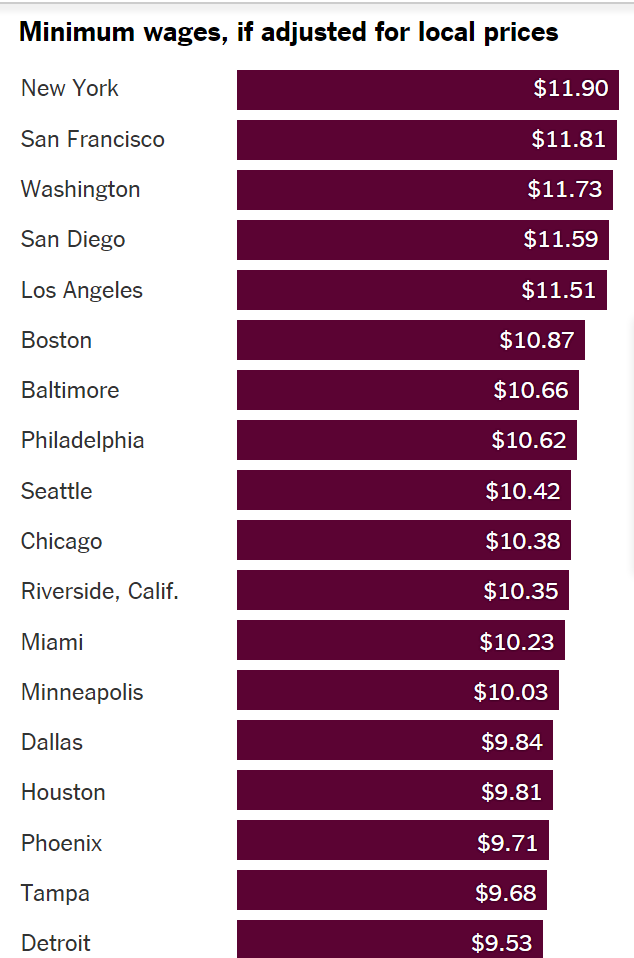
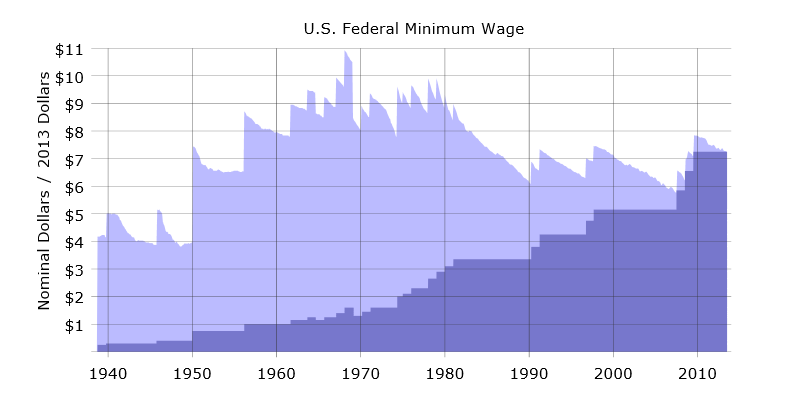
Many cities and states independently raise their local minimum wages to closer to half of the median wage because the federal minimum wage is just ridiculously low in high-wage places like New York City and San Francisco.  Dube’s proposal would standardize this tendency across the US.  Plus, businesses would be able to prepare for minimum wage hikes better if the process were standardized across the US and more predictable.  When legislatures arbitrarily adjust the minimum wage for inflation they cause relatively large, abrupt changes that are harder for businesses to adjust to.  In 1949, the minimum wage almost doubled and even small jumps can be hard to accommodate.  When Ohio suddenly raised the state minimum wage in 2008, it pushed the budget into the red at Bluffton University’s (where I work) because it was a large, budgeted expense.  Eliminating all the jagged increases on the graph below would create a more efficient system.

History_of_US_federal_minimum_wage_increases


Opponents of the minimum wage might think that a less efficient system is better because an inefficient minimum wage system might be less politically popular, but they should face up to the reality that polls consistently demonstrate that the minimum wage is extremely popular among ordinary people in both parties, so neither party will commit political suicide and abolish it despite the constant lobbying of the Employment Policies Institute and the National Restaurant Association which contacted me in a covert effort to try to fight the minimum wage.  Below is polling data showing the percent of Americans who favored raising the minimum wage and even extreme increases in the minimum wage poll favorably.  A 2016 poll found that a majority of Americans favored more than doubling the minimum wage.

Favor Oppose
2014 73% 20%
2013 Nov 76% 22%
2013 Mar 71% 27%
2005 83% 14%
2000 82% 16%
1999 81% 18%
1996 83% 15%
1995 73% 21%

The Republican Party leadership has tended to oppose minimum wage increases over the decades, but ironically the Republican Party would have the most to gain politically from a proposal like Dube’s because it would eliminate the constant opportunities for their opponents to successfully bash them.  Under the current system, as inflation erodes the real value of the minimum wage, it constantly builds more popular pressure to raise the minimum wage to adjust for inflation which eventually forces congress to pass legislation to increase it.  The Democratic Party regularly gets a political boost when the minimum wage is in the news and the Republicans are stuck defending a very unpopular position.  Dube’s proposal would eliminate the need to regularly pass laws to adjust the minimum wage for inflation and that would help the Republican leadership avoid an uncomfortable topic that regularly gives a boost to their opponents and that they always eventually lose anyhow.  The minimum wage almost never comes up as a political football in countries where the minimum wage is indexed to inflation and conservatives can focus on other political issues that are more winnable.

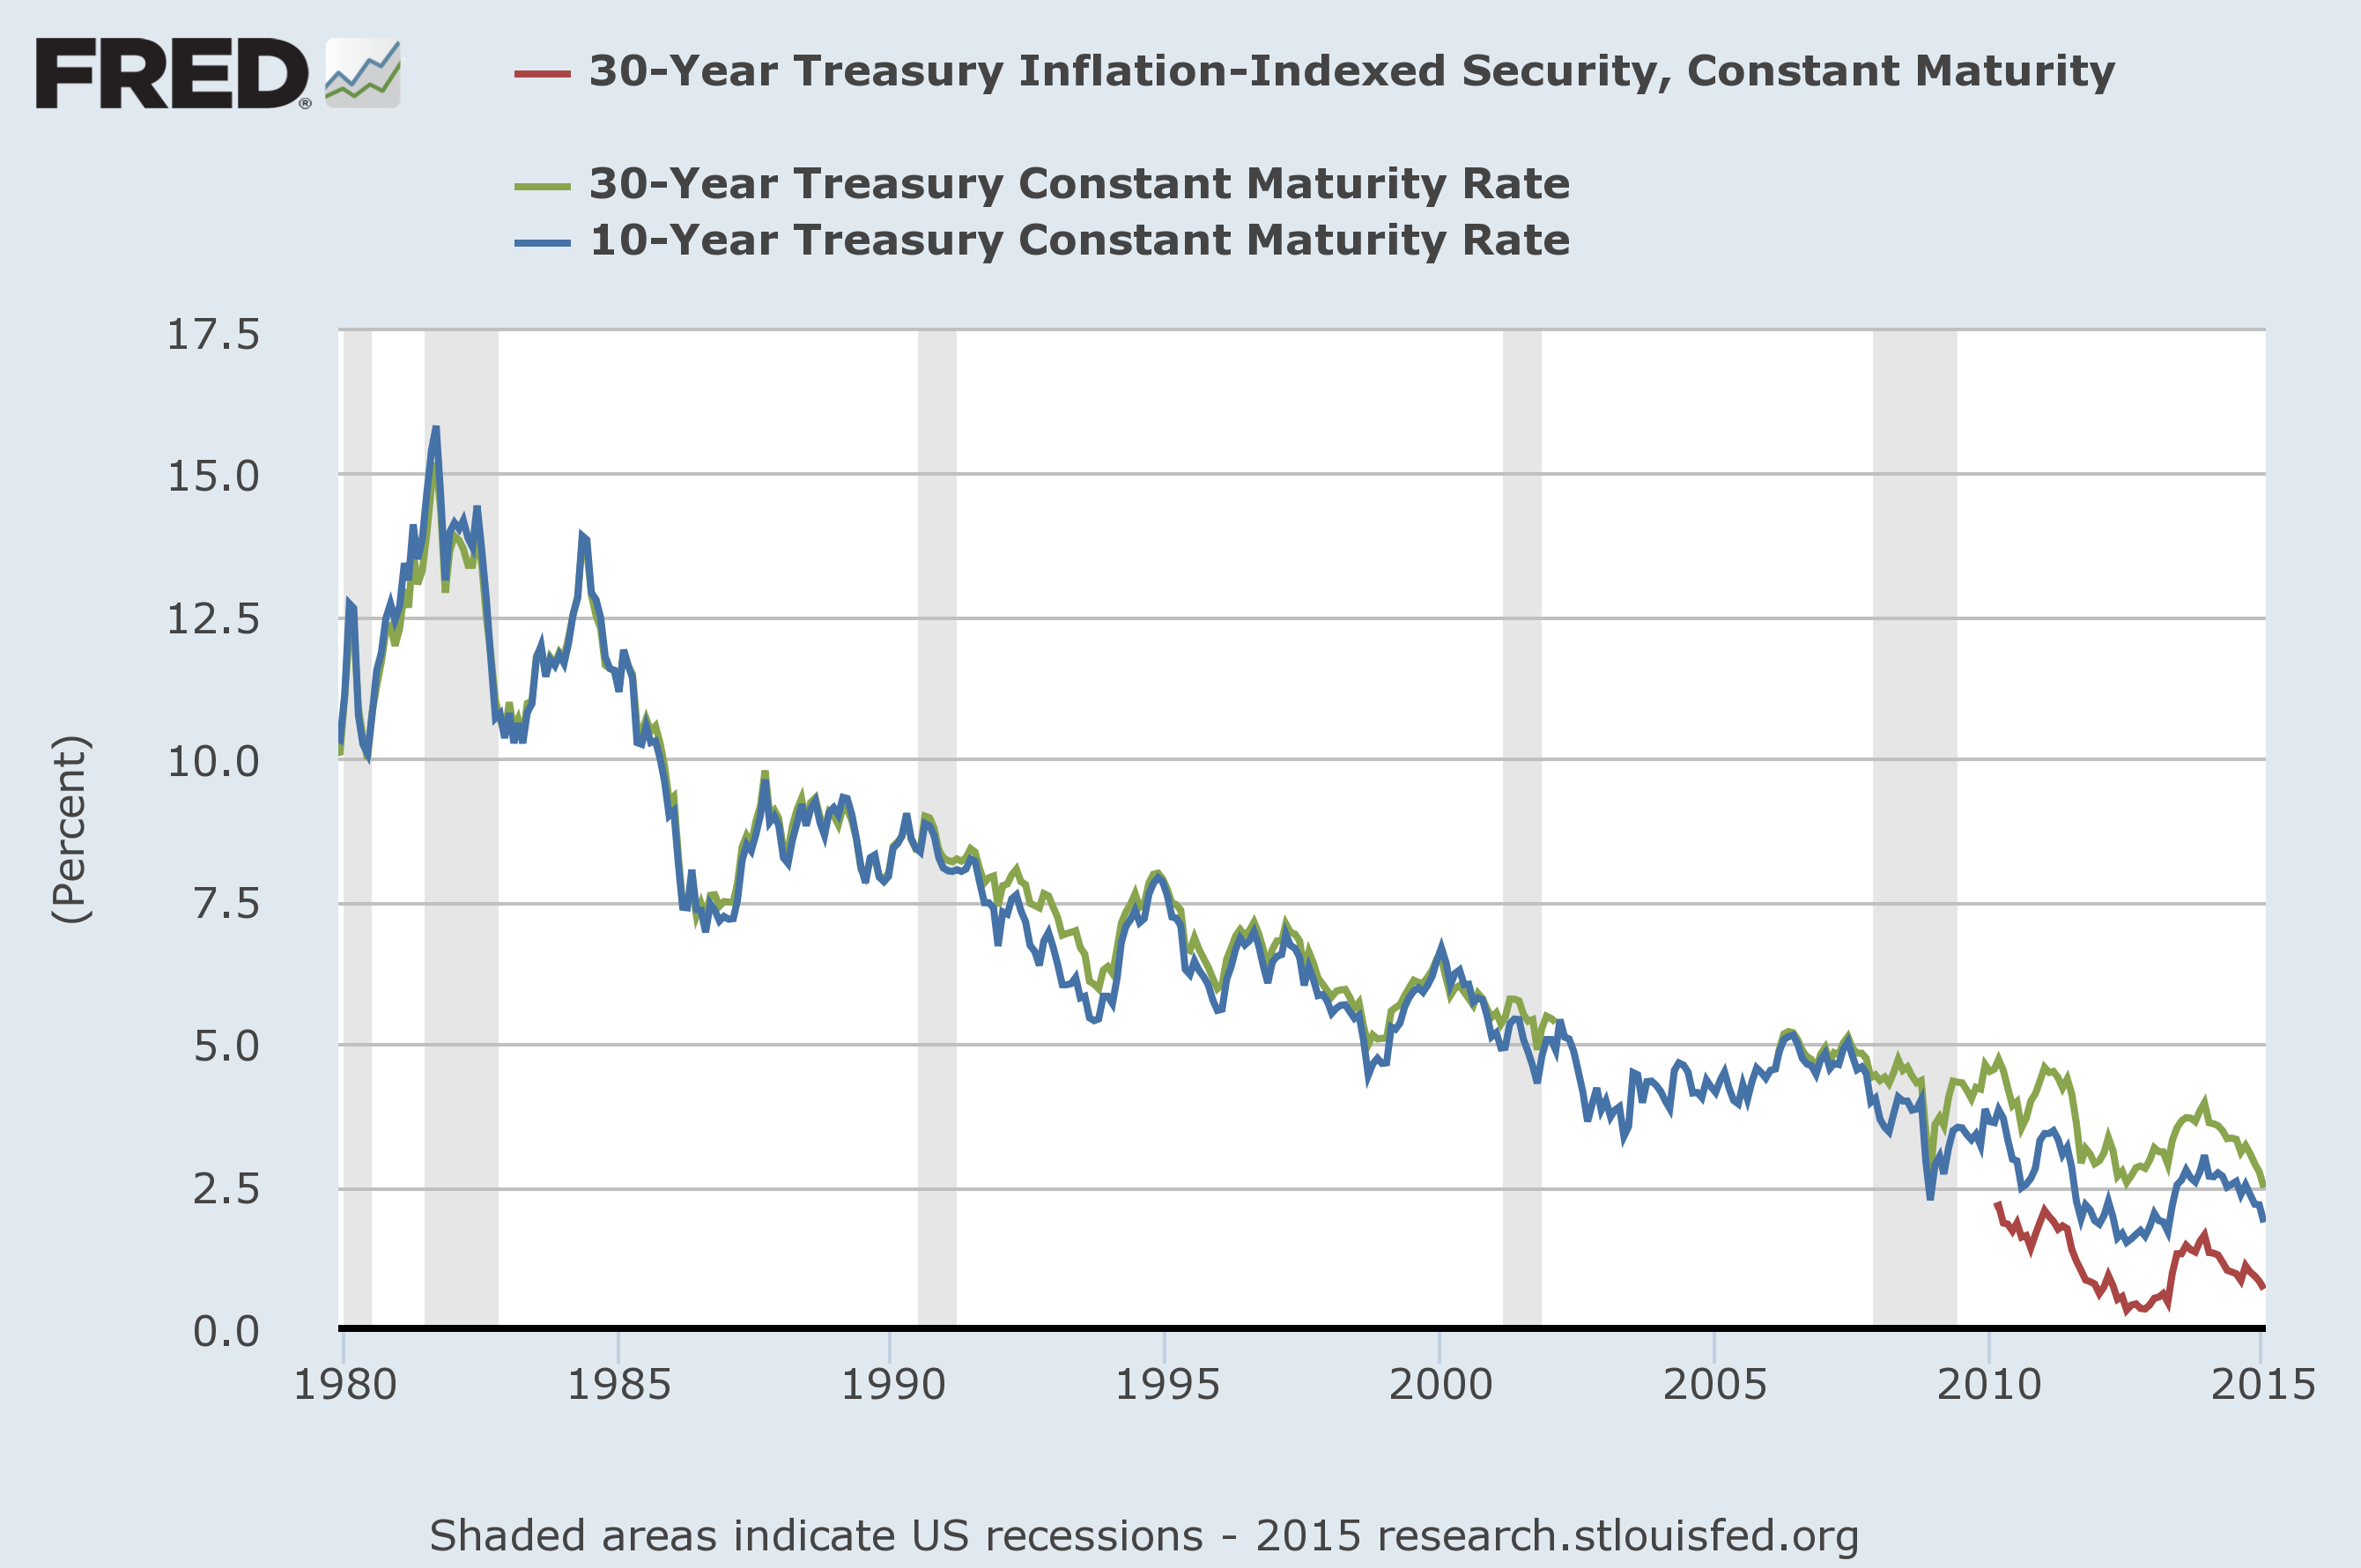
The CEPR wrote a history of minimum wage research which may help explain why the real value of the minimum wage dropped during the 1980s and stayed low since then (see the decline in the above graph in light purple).  In the early 1980s a lot of the first empirical research was published about the effects of the minimum wage and most found that the minimum wage increased unemployment.  However, the early research was done poorly and subsequent research using larger samples and more sophisticated techniques reversed the conclusions of the early findings.  But the early research probably influenced policies at the time and helped those who argued for reducing the minimum wage.  That is the power of ideas.

Economists were quite divided about whether the minimum wage was a good idea 20 years ago, because economists used to think that it hurt the poor by raising unemployment.  But the empirical studies since the 1990s have overwhelmingly shown insignificant effect on unemployment, and by 2014, a University of Chicago poll found that elite economists were fairly evenly split on whether the minimum wage causes any unemployment at all and five times more economists supported raising it than opposed it.  Below is graph from a meta-analysis of 1,492 studies about the effects of the minimum wage on unemployment that explains the mainstream view.  Note the large spike at 0 meaning zero effect, plus a large number of studies to the right of zero that actually show that the minimum wage decreases unemployment slightly!  Out of the 1,492 studies, only about 1% that have a large negative effect on unemployment.  Those are the outliers on the left, but all of them have relatively low power and all of the most powerful studies show very close to zero effect on unemployment.

Doucouliagos and Stanley (2009) conclude that there is only an extremely small effect of the minimum wage on unemployment, saying, “If correct the minimum wage could be doubled and cause only a 1 per cent decrease in teenage employment.”  That claim gives a vivid illustration of how trivial the effects of past increases in the minimum wage have been, but it is undoubtedly wrong about extrapolating from the past research to the potential effect of doubling the minimum wage.  A doubling would be much larger than almost any past increase that has been studied.  We only know that past increases have had little effect, but we do not know what would happen if we made a very large increase in the minimum wage. If we were to actually double the minimum wage, there could be a much bigger negative effect upon unemployment.  The historical evidence just can’t tell us much about that because it would be so much bigger than what we have studied.

Dube’s proposal to set the minimum wage at half the local median wage is similar to what international businesses do.  They adjust the wages they pay across the regions of the globe to reflect the going wage in different locations.  For example, Ikea pays lower wages in areas that have lower wages and costs of living.  The minimum wage should adjust to local labor market conditions as well.  Dube’s proposal is also similar to the government’s method for setting the maximum CEO wage it pays to defense contractors and private prison corporations.  Kevin Drum explains:

Apparently the federal government has a cap on the amount it’s willing to reimburse contractors for the salaries of their employees. If…  your company’s CEO makes $3 million per year, you can’t charge it all back to the feds even if 100 percent of the CEO’s time is spent on government contracts. The limit, set in 1998, was $340,000.

[If that amount had risen with inflation], by 2011 it would be around $467,000. But no. It [rose to] $763,000. Why? Because ordinary inflation adjustments are for chumps, that’s why. For purposes of charging CEO overhead to the federal government, the cap was set at “the median amount of the compensation provided for the five most highly compensated employees of all publicly owned U.S. corporations with annual sales in excess of $50 million for the most recent fiscal year.”

This rule means that taxpayers have increased what we pay to the CEOs of government contractors much faster than inflation.  The median wage and even the President of the US’s wage has not risen nearly as fast.  CEO pay on the government payroll is rising fast because, as Lydia DePillis notes, the median salary of CEOs at America’s 3,000 largest companies has risen precipitously.  By now, CEOs are billing taxpayers about double the salary of the highest paid federal government worker (the president at $400,000).  DePillis argues that the government should worry more about raising the wages of the poorest people working for its contractors rather than the richest. She criticizes the Obama administration for not doing anything about the way its privatized corporate welfare for CEOs results in lower pay for ordinary workers and higher pay for elites:

Right now, the federal government employs some 2 million people  [working for private companies paid by government contracts] who make less than $24,000 per year, or under $12 an hour. The administration could, by executive order, require that all of them be paid at least that.

Instead, Obama raised the rate to $10.10 in January 2015.  Again, Dube’s proposal is more sensible.  Just set the minimum wage for federal contractors at half the local median wage.  Since it works for CEOs at the top, why use it for workers at the bottom too?

So who gets the benefits of a minimum wage hike like the one Obama made for federal contractors? A 2010 study by conservative economists estimated that only 11% of the benefits go to poor households and they argue that the minimum wage is a bad anti-poverty program that should be scrapped, but most of the benefits of the minimum wage go to middle-class households which is probably one reason it is so popular.  An Economic Policy Institute study estimated that if the minimum wage were raised to $10.10 an hour, 77% of the benefits would go to households earning more than $20,000 per year and less than 69% would go to households below the median income.  So the minimum wage does fight poverty a little, but it is more beneficial for the middle class than for the poor.

One reason why such high-income households see benefits from the minimum wags is that young people often get minimum wage jobs and many young workers live in middle-class households.  The Bureau of Labor Statistics estimates that about 1/3  of minimum-wage workers are teenagers and Heritage estimates that 62% of young adults and teens earning the minimum wage are enrolled in school.  Raising the minimum wage would help make college more affordable for them.  Whereas the real value of the minimum wage was much higher in the 1960s and 70s, the cost of college tuition has risen faster than average.  Until the 1980s, college students could earn enough to pay for tuition solely by working a minimum wage job during the summers.  The horizontal orange line is at about 480 hours which is what a student would work in a three-month summer job at 40 hours per week.

And raising the minimum wage up to half the median wage would put it closer to the level seen in many other rich nations:

minmedian

Does the minimum wage increase inflation?  Will it increase the cost of fast food? Jordan Weissmann says that it will, but not by much:

Sara Lemos reviewed the literature and found that most studies reviewed above found that a 10 percent US minimum wage increase raises food prices by no more than 4 percent and overall prices by no more than 0.4 percent.”

But what about burgers specifically? Well, their prices would might go up a bit more. Based on data from 80s and early 90s, Daniel Aaronson estimated that a 10 percent increase in the minimum wage drove up the price of McDonald’s burgers, KFC chicken, and Pizza Hut’s pizza-like product by as much as 10 percent.

This is wrong.  A 10% increase in the minimum wage cannot conceivably increase fast food prices by 10%.  You know the above quote is wrong because of simple back-of-the-envelope math, and if you look at the original research cited at the above link, you will see that it too claims that the minimum wage is associated with trivial increases in prices.  The math just does not work for a 10% increase in minimum wage to increase prices by 10% because that would imply that minimum-wage labor is the only cost involved in producing fast food!  For example, suppose it takes one hour to make one burger and McDonalds is selling burgers at cost.  If wages are $10, then a burger will cost $10 if wages are the only cost of producing burgers.  If wages rise 10%, then prices of burgers must rise 10%.  But that is ridiculous because minimum wage labor is only a small fraction of the cost of producing burgers.  The owners of fast food restaurants get paid considerable money to compensate them for the fixed costs of the buildings, advertising, equipment, etc.  There are managers and accountants who get paid more than the minimum wage, and there is the cost of the meat, bread, packaging, cheese and other inputs that is produced in industries where minimum-wage labor is a tiny fraction of the total costs.  Steven Buckley estimated that TOTAL labor costs in the restaurant industry vary from only about 25% of total costs in fast food up to a high of about 40% in table-service restaurants, and even that greatly overstates the effect of minimum wage labor because of the jobs that pay more than the minimum wage like supervisors, accountants, marketers, and others.

In the US economy as a whole, labor compensation is about 60% of total income, but less than 3% of HOURLY workers earned the minimum wage and high-income workers are not among the hourly workers.  Because minimum wage workers earn a fraction of what the average worker earns, the share of total GDP that is accounted for by the minimum wage is undoubtedly far less than 1% of national income.  Even if the minimum wage were increased 10% , it is unlikely to increase prices by a tenth of one percent which is unmeasurable relative to the inherent noise and uncertainty in our inflation measurements.

If you are worried about the effect of labor income upon inflation, you should be more worried about pay for elites because the minimum wage is simply a nothingburger in the US economy compared to the BONUSES of Wall Street. Here is data from The Institute for Policy Studies.

wall st vs min wage

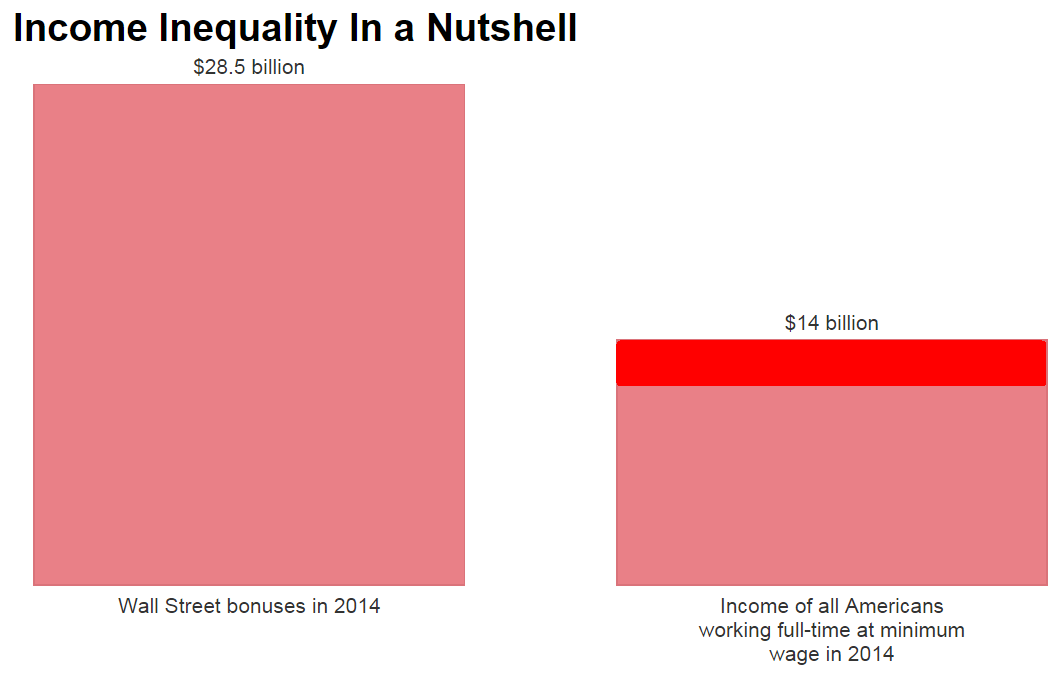
The left side isn’t measuring total Wall Street compensation.  It is only executive bonuses on top of ordinary pay.  And you shouldn’t compare that with the total income of full-time minimum wage workers because even without the minimum wage they would be paid most of that money anyhow because the minimum wage is pretty close to the equilibrium market wage.  The minimum wage only adds a bit to the top of the wages that low-wage workers would have earned without a minimum wage.  I added a little red rectangle that shows my guess at how much money the minimum wage might add to low-wage incomes.  Bonuses were $28.5 billion versus maybe something like $3 billion that the minimum wage actually cost.  The anti-minimum-wage lobbyists claim that they are worried about the detrimental effect of the minimum wage upon inflation and prices, but they should probably be more worried about Wall Street executive pay than about the pittance that low-income Americans earn.

Posted in Inequality, Labor, Medianism

Highest International Inequality Zones

Branko Milanovic wrote a good article about global inequality measures which ends with an examination of the pressures for immigration.

 if you classify countries by their GDP per capita level into four ‘worlds’, going from the rich world of advanced nations (with GDPs per capita of over $20,000 per year) to the poorest, fourth, world (with incomes under $1,000 per year), there are seven points in the world where rich and poor countries are geographically closest to each other – whether it is because they share a border, or because the sea distance between them is minimal. You would not be surprised to find out that all seven of these points have mines, boat patrols, walls and fences to prevent free movement of people.  The rich world is fencing itself in, or fencing others out. But the pressures of migration are remaining strong, despite the current crisis, simply because the differences in income levels are so huge. I conclude with something that resembles a slogan: either poor countries will become richer, or poor people will move to rich countries.

The seven examples he lists are five land borders:
US – Mexico
Greece – Macedonia (or Albania)
Saudi Arabia – Yemen
South Korea – North Korea
Israel – Palestine
And two water borders that are cheap to cross:
Spain – Morocco
Malaysia/Singapore – Indonesia
Hong Kong is another one of these borders even though it is legally the same country as China, in practice, there is a border fence and Hong Kong operates very separately from China.
But there are many more nations spending billions of dollars building enormous walls to keep out poorer neighbors.  Wikipedia has a list with some surprising examples.  For example, India has by far the biggest anti-immigration infrastructure project in the world even though India is the world’s largest net exporter of people.  India had the biggest net emmigration in the world in 2012, and at the same time, India was spending billions of dollars trying to keep more people from coming in.  India is working on over 5,000 kilometers of fencing.  This is not much shorter than the Great Wall of China.
UPDATE 2015/02/26: Welcome Branko Milanovic Twitter followers.  Wow are you guys an international bunch.  When other Americans like Brad Delong or Forbes have linked to my site, I have mostly gotten US readers.  Branko’s followers are from all over the globe and only about 15% from the US so far.  Is that due to World Bank connections?
I’ll add a couple pictures of two high-inequality borders I have crossed.  If I were more ambitious (or wealthier) I would put it on my bucket list to cross all of the borders that Branko listed because they are fascinating places.
Hong Kong Border Patrol
They look a bit more cuddly than the American border patrol:
Border_Patrol_ATV_IMG_5278
 The Spain-Morocco border is partly a water border and partly a land border.  Spain controls two cities on the coast of Africa where immigrants are constantly trying to cross over the fence into what is legally a part of the European Union.  In 2005, 13-18 people were killed by police and over 50 injured during a single day of attempted border crossings into Ceuta. People die attempting to cross into Spanish territory every year.  Here is a picture of the Morocco-Spain land border at Melila:
 VerjamelillaMorocco also has an an approximately 2,700 km-long wall to keep undesirables out on its other border too, so most immigrants to Spain also have to sneak into Morocco before they can try to sneak into Europe.
Posted in Medianism

Is The South-East Quadrant Of Asia Special?

China, India and nearby countries have been the most important drivers of world GDP from the dawn of agriculture until the industrial revolution when Europe finally boomed along with some European offshoots like the USA.  Asia has always been the center of humanity because of a resource that they have had in abundance since the beginning of agriculture.   Consider the center of world GDP.  If every dollar of income in the world were tugging upon the surface of the world equally, the center of the world economy would shift around on the surface of the globe to follow GDP at different points of time.
mckinsey center of econ gravityThe word ‘China’ in Chinese means ‘the center country’ because China saw itself as the center of the globe during most of the 20th century.  Although the center of global GDP was a bit west of China, it was pretty close to the center of the world’s economy until the industrial revolution around 1800.

Piketty_World_OutputThe graph above shows that Asia had 60% of world GDP until around 1800 and most of Asia was pretty empty.  It was really only the SE corner of Asia where most of economic activity was concentrated due to a particular abundance of their special resource.

more in circle than outThey had (and still have) most of the world’s people. In the following map, each nation has been resized so that area is proportional to population.  (Click on the map for a larger image.)

HhqlkMK

But people aren’t a special resource that doesn’t exist elsewhere.  The red parts of Asia have an enormously high population density because of another technology.

population_density

NASA

Notice how closely the population density map mirrors a map of modern rice production. The following map stretches the area of each country to match it’s percent of world rice production which shows how much is concentrated in East Asia.

rice

Even the high-population areas of west Africa are rice-cultivating areas.  In fact, the region around Nigeria independently developed a native strain of rice around 1500BC although Asian rice varieties are more productive and has largely supplanted the native African rice today.

1280px-RiceYieldAndrewMT

Rice production caused high population density.  Rice was even more important before 1800 when scientific and industrial revolutions (along with high-productivity new crops from the American conquest: corn and potatoes) boosted agricultural production and population in Europe and northern America.

Rice-growing areas have had high population density because one harvest of rice produces more calories per acre than most other crops, and also because rice can produce three harvests per year rather than one or two for most crops.  Rice caused a population boom because of a combination of the productivity of rice and locations in Asia that are blessed with some of the most productive agriculture in the world due to excellent soil and climate:

land for cropsradical cartography

Somehow the secrets of intensive rice cultivation didn’t make it out of Asia until modern times.  Rice seeds made it to the Roman empire, but they had little impact on the diet and population density because nobody figured out how to grow rice as intensively as the Asians.  The Moors also brought rice to Spain in the 10th century, but again, they must not have had the technology to make it as productive as it was in Asia and the Christians didn’t seem to keep up the practice after they drove the Moors out.  Only the SE quadrant of Asia mastered the technology of intense rice cultivation.  Why no other major civilization could master it is a mystery to me, but I suspect part of the answer lies in the fact that some kinds of information (technology) can be very difficult to transmit.

Corn has a similar story of bad technological adoption.  Corn is a similarly miraculous grain with amazing productivity per acre.  Its productivity was the basis for Native American empires which boasted some of the largest cities in the world during their heyday.  They  constructed the largest pyramid in the world in Mexico (which was destroyed by the Spaniards and converted into the base for a church).

Corn is truly a miracle plant.  The picture below shows how much more productive a domesticated ear of corn is than the tiny ear of the wild corn (teosinte) was.  The low-productivity ancestor of corn is nearly unrecognizable next to the pocket knife. If Monsanto invented corn today, they would have undoubtedly patented it and could sell seeds for a very high price because it is so productive.  (As it stands, Monsanto controls 60% of the corn and soybean seeds sold in the US because of patented seeds that offer marginally higher productivity.)  If Monsanto introduced corn as a new food today, people would take one look at the monstrous grass (yes, it is a crazy big grass plant) and reject it as a frankenfood.

maize_and_teosinteJohn Doebley

After the Americas were colonized, the conquistadors brought corn back to the old world where it dramatically increased agricultural productivity, but it did not become the basis for high population density like in Mesoamerica partly because the Eurasians did not learn to soak it with baked limestone before eating it, a process known as nixtamalization.

It probably seemed barbaric to put baked limestone into food, but this process makes corn much more nutritious and eliminates problems with pellagra, a nutritional deficiency disease that was unknown in the corn-based Native American societies. Pellagra became endemic among impoverished Eurasian and African peoples who depended on eating corn because they didn’t know about nixtamalization.   Pellagra victims look pretty bad:

Pellagra2Herbert L. Fred, MD, Hendrik A. van Dijk

Because corn has such high productivity, more corn is produced today than any other grain in the world, but partly because of its reputation for nutritional diseases like pellagra, it is mostly fed to lifestock rather than eaten by humans.

So ideas don’t always travel across continents as easily as physical goods even though ideas are weightless.  Ideas like nixtamalization and intensive rice cultivation could have transformed the rest of the world, but only the physical corn and rice seeds successfully made the journey.  Today some ideas rapidly spread around the globe, but many of the most important ideas are still more difficult to spread than heavy goods.  That is why education is so expensive.  The knowledge itself is ubiquitous in libraries and on the internet, but it is still expensive to figure out how to use knowledge in a life-changing way.

Intensive rice production requires a lot of informal education.  It requires flooded fields which means that they must be perfectly level and surrounded by dikes and a canal system for pumping water in or out of the rice paddies to keep the water at the right level throughout the growing season and the ability to completely drain the fields before harvest.  The flooded fields eliminates weeds and maintains perfect moisture and reduces erosion which keeps the long-run soil fertility high.

rice.terraces

Ronald Tagra

Flooded rice fields require a lot of water and this corner of the globe has bountiful rain:

annual_precip
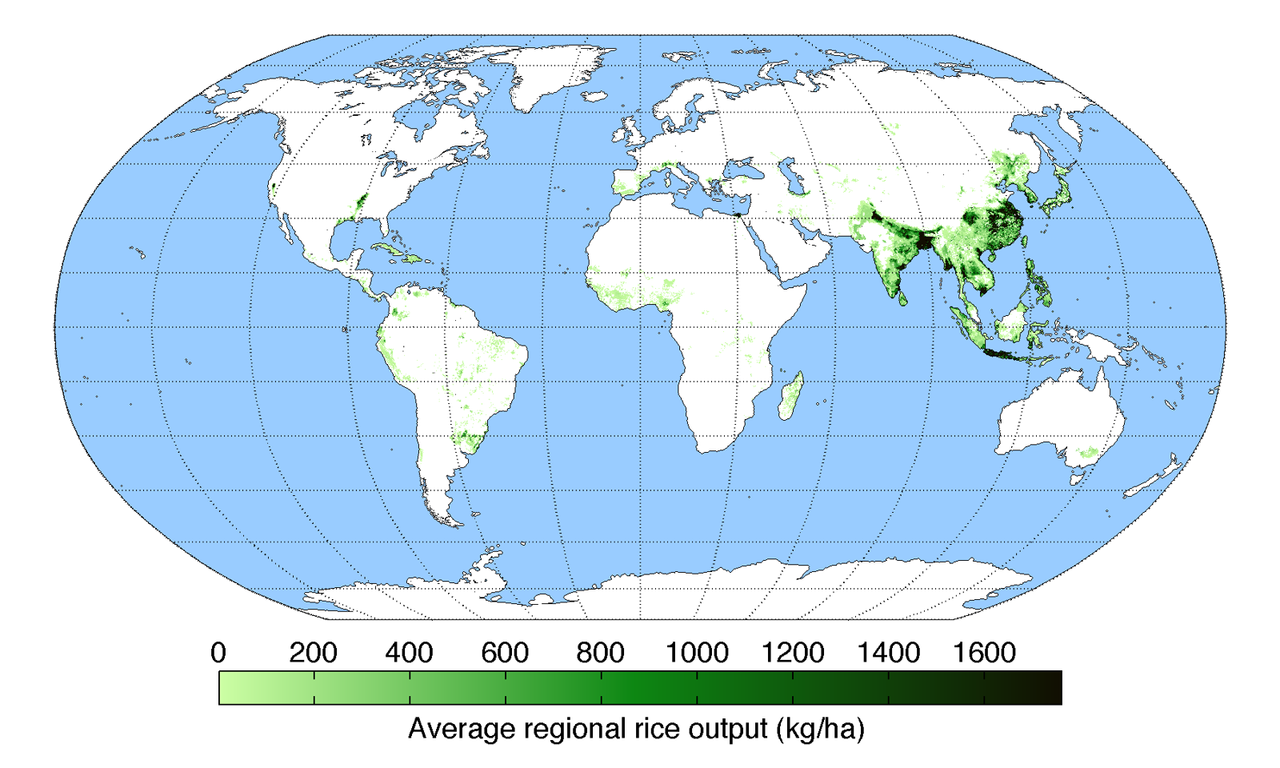
Rice is commonly grown in small nursery plots in 5% of the field for a month or two before transplanting out into the rest of the field for the final months of growth.  By transplanting the rice seedlings, farmers can grow three full crops per year in tropical regions.  Transplanting rice isn’t an obvious technology to copy and intensive rice production requires many more techniques that are difficult to copy (like using
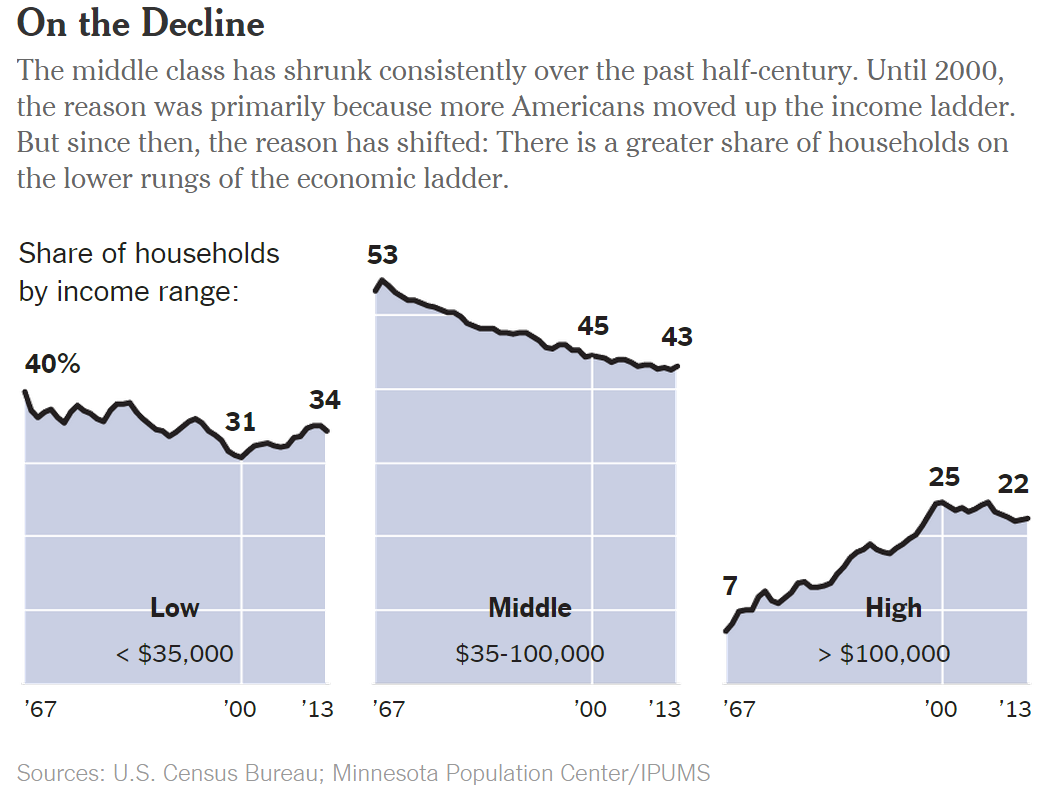
 humanure for fertilizer). Without all the techniques that are part of the Asian rice toolkit, rice did not revolutionize the rest of the world like it transformed Asia.  Modern communication and transportation has made it much easier to replicate technologies and the most productive rice producers (per acre) are now in places like the US and Australia that are outside of the traditional rice zone, but despite having higher productivity than in Asia, there is still relatively little area devoted to rice outside of the ancestral region.

Over the past century, Western nations finally succeeded at copying and even surpassing Asian rice production methods.  Since the 1980s, the Asians in the rice zone also finally succeeded at copying the West’s industrial revolution and catching up.  That is why the center of world GDP is inexorably shifting back to where it was for most of history.

Economic growth is increasing because new information technologies has been helping knowledge spread faster.  In the 1500s the printing press opened up the age of discovery and the industrial revolution for European nations which led them to grow much faster than nations that were slower to adopt printing.  Now the spread of the internet is helping poor nations catch up with rich nations because ideas are spreading much more easily to every corner of the globe.

WorldPopulationHistory.org has a video showing a map of global population over the past 2000 years.  Some highlights:

  • 1:30 → China and India were already a LOT bigger than the Roman empire at its peak.
  • 3:00 → By the year 1,000, China and India make Europe look like a miniscule backwater.
  • 3:20 → The Mongol invasion kills 40million-70million people across Asia in the early 1200s. Watch the lights go out in China in particular.  This is by far the deadliest war in human history as measured as a percentage of the total population killed.  So many people died that much of Asia reforested.  The new trees sucked so much carbon dioxide out of the atmosphere that it is visible in the carbon record.
  • 3:30 → The bubonic plague kills about 1/3 of Europe.
  • 4:15 → European population explodes around 1800 due to the industrial revolution and finally starts to rival India and China in population density, but European population growth slows in the 20th century whereas it takes off again in India and China due to medical advances that caused the demographic transition first in Europe and later in China and India.
Posted in Development, Globalization & International

¡¿”No one actually knows who is in the middle class”? That is crazy. It isn’t rocket science.

Ezra Klein complains today that “no one actually knows who is in the middle class” because he wants to define a dollar income that can define the “middle-class line” like the way we define the poverty line.

In the New York Times, Dionne Searcey and Robert Gebeloff try to create [a middle-class line], defining “middle class” as households making more than $35,000 and less than $100,000. Using this definition shows that the ranks of the middle class have been thinning for decades.

middle class

That is a silly definition of middle class.  Poverty at least potentially refers to some absolute level of material deprivation, but “middle” is nothing if not a relative term.   You cannot have a middle without something above it and below it.  If the lower class gets more income, it must shift our definition of the middle income and this has been a natural process throughout history.  The absolute definition of middle class in the above graph would have been laughable 100 years ago.  The best way to define middle class is to describe statistical properties of the income distribution. Two easy ways to statistically define the middle class are the middle tercile (the middle third) and the middle majority (the 50% centered around the median).   The only reason that we don’t have a good definition for the middle class is a shocking lack of creativity and clarity by thought leaders like in Ezra Klein (as displayed in his essay) and political leaders like Obama.  Obama loves to talk about the middle class in a fuzzy way that includes pretty much everyone, but the middle cannot include everyone.  At the very most, could be defined to include the middle majority, but no more or concept ceases to describe the middle.  Even using the middle majority requires lumping together the 75th percentile with the 25th percentile which are two groups that experience very different economic conditions.

The above graphic is confusing because the authors interpret it as demonstrating that middle class people were actually becoming better off from 1967 to 2000, even though the graph is declining which makes it look like the middle class is in decline.  The reason why they have such a counter-intuitive interpretation of the graph is that people were moving from the middle class to the “high” class.  The graph also appears to show that both the middle and high income classes have been falling into the lower class since 2000.  That is a bit misleading too because high income people have done very well since 2000.  Even as their numbers have fallen, their incomes have risen, so a better measure would show that incomes of the richest have been rising, not that the richest have been hurt by shrinking numbers of people.  The above graphic uses an odd, misleading measure that would be useless for comparing the US with most countries in the world (and most of history) where almost everyone would be in the low category.

Middle class is still an important concept throughout history and around the world, so we need a better definition that applies across time and geographic boundaries.  The income of the median, middle tercile and the middle majority are three obvious statistical measures that are all superior to the odd examples used above.

The median income is the simplest measure of the state of the middle class.  Or if you want to use average incomes, then take the average income of the middle tercile.  Either of these measures would more accurately show that the middle class did poorly for most of 1967-2013, with some partial recoveries like during the 1990s and since 2011.  You can see the very modest improvement in the fortunes of the middle class since 2011 on the latest graph of median income (red line) from Sentier Research:

HouseholdIncomeIndex_UnemploymentRate_12_2014A recent New York Times poll found that only 1% of people think of themselves as upper class and 12% consider themselves upper-middle class.  71% of Americans consider themselves to be middle class or working class (which the poll put as being between middle class and lower class.  If you add in the people who are in the upper-middle class, that means that 83% of Americans are not upper class (the top 1%) nor lower class (the bottom 15% in the poll).  That shows a ridiculous lack of class consciousness that has been a longstanding confusion because elites have avoided using a straightforward definition like the middle majority.  90% of Americans would agree that the top 10% richest Americans are NOT in the middle class, but 90% of the richest Americans think that they are part of the broad middle class.  If nobody can define middle class, then it is a useless term and should be discarded in favor of the middle majority.  That is a clear, self-explanatory concept.

Posted in Middle class

National Debt is NOT like Personal Debt

Note: There is a newer version of this post.

Krugman explains that government debt can never be repaid when we owe it to ourselves.

Deficit-worriers portray a future in which we’re impoverished by the need to pay back money we’ve been borrowing. They see America as being like a family that took out too large a mortgage, and will have a hard time making the monthly payments.
This is, however, a really bad analogy in at least two ways.
First, families have to pay back their debt. Governments don’t — all they need to do is ensure that debt grows more slowly than their tax base. The debt from World War II was never repaid; it just became increasingly irrelevant as the U.S. economy grew…
Second — and this is the point almost nobody seems to get — an over-borrowed family owes money to someone else; U.S. debt is, to a large extent, money we owe to ourselves.
This was clearly true of the debt incurred to win World War II. Taxpayers were on the hook for a debt that was significantly bigger, as a percentage of G.D.P., than debt today; but that debt was also owned by taxpayers… So the debt didn’t make postwar America poorer. In particular, the debt didn’t prevent the postwar generation from experiencing the biggest rise in incomes and living standards in our nation’s history.
But isn’t this time different? Not as much as you think.
It’s true that foreigners now hold large claims on the United States, including a fair amount of government debt. But [Americans now hold large claims on foreign nations too.] Every dollar’s worth of foreign claims on America is matched by 89 cents’ worth of U.S. claims on foreigners. And because foreigners tend to put their U.S. investments into safe, low-yield assets, America actually earns more from its assets abroad than it pays to foreign investors. If your image is of a nation that’s already deep in hock to the Chinese, you’ve been misinformed. …
Now, the fact that federal debt isn’t at all like a mortgage on America’s future doesn’t mean that the debt is harmless. Taxes must be levied to pay the interest, and …taxes impose some cost on the economy, if nothing else by causing a diversion of resources away from productive activities into tax avoidance and evasion. But …nations with stable, responsible governments …have historically been able to live with much higher levels of debt than today’s [levels]. Britain, in particular, has had debt exceeding 100 percent of G.D.P. for 81 of the last 170 years. When Keynes was writing about the need to spend your way out of a depression, Britain was deeper in debt than any advanced nation today, with the exception of Japan…

If countries can have government debt that is higher than 100% of national income (GDP), then why not always borrow?  The problem with too much government debt is high interest rates.  If the government borrows too much, it could suck up all of the cheap loanable funds which would cause higher interest rates for everyone.  And an interest burden is an extra redistribution from taxpayers to savers that should only be done when the benefit exceeds the dead weight loss of the extra taxes to pay the interest.  The basic rule is that you should borrow money to pay for an investment with a long payback period where the return on investment is greater than the interest payment.

We are not bankrupting future generations by borrowing from Americans.  We are committing to raise taxes on future generations in order to pay other people in that generation who will inherit the bonds.  It will just be a transfer from future taxpayers to the future heirs of the people who are currently lending their savings to the government.  As Moneybox writes:

If you think about a household that’s facing some obvious future expense (retirement or kids going to college) the thing you want to do is reduce consumption below income. The idea is to accumulate financial assets—stocks and bonds and bank accounts… Then in the future when you need consumption to exceed income you can liquidate your financial assets. This same strategy also works great if you’re Norway or Abu Dhabi or some other small country.

To “save money” means to lend it to someone else.  The only way for a country to truly save money is to lend it to foreigners.  Norway, Abu Dhabi, Japan, and China are examples of countries that are doing just that and Norway is explicitly doing it to save money for their greying population.  As the Norwegian population becomes more elderly, they will spend down their national savings held abroad, and that will help pay for elder care.  But Norwegian population is only a few hundred thousand people larger than the Detroit metropolitan area, so they can get away with lending money abroad to save for retirement (just like Detroit could save by lending to Wall Street).  But the US is over 20% of the world economy.  The massive size of the US economy makes it much less practical to lend large amounts abroad and we mostly borrow from ourselves.

 Plus, the US borrows in our own currency and we have the ability to pay back our debt to foreigners by simply printing more of our currency.  Would you be worried about paying back debt if you had a printing press to print money sitting in your basement?  The US government really does have a printing press, so the government should not be worried about debt.  The lenders should be worried about inflation, but they are not because they are lending money to the government at historically low interest rates.  There has never been a debt crisis in any country in a currency that the country could print.   Greece would have no problem today if it borrowed in its own national currency.  Greece’s problem is that it borrowed in euros which are controlled by the ECB in Germany.
The only salient danger of government borrowing is whether it raises interest rates which could crowd-out private investment (which isn’t currently happening) because the only thing that really matters for future generations is the investment in real assets that we leave for them.   If rapture happened and a group of Bluffton University students were the only people left behind on earth, how would they save for retirement? The government debt problem would have completely vanished.  Moneybox (mentioned above) examines this too.

The result is that we’re basically left with a much more primitive kind of savings problem. Something closer to a farmer in the pre-industrial era who’s trying to save up for winter. To save for winter you can’t just sell your surplus food during the fat months and stockpile financial assets. During the lean months there won’t be any food for sale. You need to actually stockpile surplus food and other tangible commodities. That means [smoking meat], finding a dark cool place to stash your potatoes, chopping a bunch of firewood, etc.
…The idea is to tradeoff [current] consumption in order to obtain long-lasting goods. The federal government, …unfortunately, doesn’t engage in proper balance sheet accounting. So if you borrow $10 million to do road repairs, that shows up as an increase in indebtedness. The right way to think about it, however, would be that the road is a depreciating asset that has a value. Every year it goes unrepaired, its value declines. So borrowing $10 million to fix the road might improve the government’s net financial position, depending on [how much value the project creates]. Right now we’re at a time when it’s never been cheaper to finance federal borrowing. Consequently, borrowing money and spending it on sound projects of long-duration is the best way we have to “save” for the future even though it technically adds [financial] debt. Now of course spending money on something dumb doesn’t help. But deferring repairs and useful investments for the sake of borrowing less is going to leave us poorer in the future rather than richer.

To add to this last point, if you were running a huge corporation, and sometimes it costs 15% interest to borrow money and other years it costs 2.5% interest.  When would you borrow more money to pay for long-lasting infrastructure investments, when interest rates are high or when they are low?  

10-yr treasury interestFRED Graph

Note that most economists don’t seem to have thought much about this kind of analysis, and it is controversial among some economists how have thought about it.  For example, Nick Rowe argues against Krugman’s thesis, but I think Rowe is confusing himself with his models because it isn’t really clear what he thinks Krugman is wrong about.  I think everyone should agree with Rowe’s main point that, “the burden of debt is about incentives, not about having to deliver resources to other people.”  That is why I said that high interest rates crowding out productive private investment is the only danger of government borrowing.  But then Rowe creates a misleading model that claims that apples can travel through time from future generations to the present: “It is exactly as if apples travelled back in time, out of the mouths of cohort C into the mouths of cohort A.”  This model is misleading because it requires unrealistic assumptions, and obscures the real issues.  The real issue is quite simple.  If the present generation (cohort A) spends resources maximizing present apple production rather than planting apple trees that will increase future apple production (by sacrificing some present production), then the additional apples today (for cohort A) will come at the expense of future apple consumption (for cohort C).  In practice, that has much less to do with whether government spending is funded by borrowing or taxation than with how government spends and taxes.  Government spending and taxation have a much bigger impact on investment (in apple trees and other capital) than government borrowing does.
There has been a longstanding debate about whether Rowe is right that government borrowing from Americans could be said to literally put a debt burden on future Americans or whether borrowing within America is just a zero-sum transfer.  The second view is clearly always correct, but the Rowe’s view can have merit in certain circumstances.  The main issue is simply whether government borrowing could be raising interest rates that would crowd out private investment.  This would only be a problem when private investment is more productive than the public investment that government does.  Most Americans probably think that private investment is always more productive than government investment, but some public investments are incredibly productive.  That is one reason why rich, productive nations have much greater public investments than poor nations.  You need both kinds of investment, private and public, to have a rich society, and it is usually hard to tell when there is too much public investment spending or too little.  Are our public roads and university labs and water systems over-built or under-built for future generations?  It is hard to tell.  A big reason Rowe’s argument is misleading is that government borrowing can also make future generations richer!  For example, if the government gets a higher return on investment than the real interest rate that it is borrowing at, then government borrowing reduces the debt burden of future Americans by Rowe’s logic.  The real interest rate is currently 0.17% (for 10 year loans) and it has been less than 1% for over four years.  It was negative for a year and a half.  It is really easy to invest in education, roads, health, and water infrastructure and get more than a 0% return on investment!   Rowe is misleading because he decided to obsess on the opposite possibility (which is also real) in which government borrowing makes future generations poorer, but his model could easily show the opposite result: government borrowing can increase the number of apples that future generations get to eat at the expense of present consumption!
Crowding out of private investment is the main danger of government borrowing and Rowe’s argument has particularly bad timing because there is more evidence that government borrowing has not been crowding out private investment during the past decade than almost any time in history.  That is because interest rates have been at historic lows and private companies have been hoarding their cash rather than investing it.  So recent government borrowing has not been impoverishing future generations.  The era that economists suspect that there was the biggest problem with government borrowing was in the 1980s when government borrowing rose, interest rates were high (the red line on the graph), and private investment fell (the blue line on the graph) despite otherwise healthy economic growth.
private interest and investmentFRED
Private investment is still depressed today, but it is cannot be because of government borrowing because interest rates are so low and corporations are hoarding cash.1  Private investment is low because of the lingering effects of the financial crisis and recession of 2007 or perhaps some sort of secular stagnation problem.
1It is complicated to measure how much cash our companies are hoarding, but it is higher than usual by many measures.  Forbes magazine is a staunch defender of Corporate Power against ordinary Americans, but even when Forbes’ Jeffrey Dorfman tried to defend our corporations from critics, he to admit that American corporations have ample access to cheap cash: “With economic times being uncertain, it is no surprise that companies (and people) are holding a little extra cash. …Businesses are holding slightly more cash than usual when measured as a percent of annual sales (13 percent versus 10 percent)…”  Dorfman said that we shouldn’t count some corporate cash because it is borrowed money that they have sitting in their checking accounts.*  That just reinforces my point that there is no crowding out.  Dorfman gives the examples of Walmart and Apple each borrowing billions of dollars that is just sitting in their coffers* with no productive use.  They are just borrowing extra cash because it is so cheap for them to borrow right now.
*Ok, the money isn’t literally sitting in checking accounts or coffers like an individual might have.  It is in the corporate equivalent: liquid assets that are sitting idly on their books rather than being invested to increase productivity.
Note: This post is an update of an old blog post.
Posted in Macro, Public Finance

Interest Burden Is More Important Than Total Debt

Who has a bigger debt?

Total Debt Outstanding Interest Rate Monthly Payments
Barry $100k 2% $370
Ronny $40k 11% $381

Both Barry and Ronny have the same incomes and both expect to pay off their debt in 30 years at the monthly payment rate. Who would you rather be?  In this scenario, Barry has a lower real debt burden because he has lower monthly payments.  Every single month for 30 years  Barry is better off.  This is how lower interest rates literally make borrowers wealthier. Ronny could borrow twice as much money and still have a lower real debt if his interest rate dropped from 11% to 2%.  This is also why people spend more money on houses when interest rates drop.  Borrowers become wealthier because they can borrow more, so they buy bigger houses.  The only scenario where Ronny’s debt burden is smaller than Barry’s is if they pay off their debts early.  That would reduce the benefit of low interest rates, but few people pay off their debts early.

For example, the US federal government rarely pays off any of its principle debt at all.   It usually just pays the interest and borrows more principle.  Again, the interest rate is a crucial part of the real debt burden.  Here is a similar example for public debt:

Debt
Outstanding
Interest Rate
(10-year treasury)
Annual Interest Payments
(% of GDP)
Obama (Feb 2013 – Beginning of second term)   100% of GDP   2% 1.3%
Reagan (Feb 1985 – Beginning of second term)   40% of GDP  11% 3%

This example only includes interest payments rather than amortizing the principle in the payments too, but the same principle applies as in the first table. In the most important way, the real debt burden was lower at the beginning of Obama’s second term in 2013 than it was at the beginning of Reagan’s second term in 1985.   The real burden of a debt is the amount of income that must be sacrificed to pay for debt service which is the blue line in the graph below.

fed debt

Most people look at the green line as the measure of debt burden, but the blue line is just as important if not more so.  Dean Baker says that the blue line (interest payment) is a better measure of our government debt burden than the green line (total amount of debt).  Note that when he was writing, the interest rate was expected to rise but it hasn’t so far.  And what would happen if interest rates did rise?  Baker has a good answer for that too:

Suppose we issue $4 trillion in 30-year bonds in 2012 at 2.75 percent interest (roughly the going yield). Suppose the economy recovers, as CBO predicts, and the interest rate is up around 6.0 percent in 4-5 years. The federal government would be able to buy back the $4 trillion in bonds it had issued for roughly $2 trillion, immediately eliminating $2 trillion of its debt. This will make those who fixate on the debt hysterically happy, but will not affect the government’s finances in the least. It will still face the same interest obligation.

I am not as sanguine as Baker about rising interest rates, because the government would eventually have to refinance its debt at higher interest rates.  But Baker is certainly correct that interest rates have no impact on outstanding debt that has already been sold to the public.  Only new debt (and rolled-over debt when it must pay back old bonds and sell new ones) will face a higher interest burden.  That would still be a problem in the future if interest rates rise because the government almost always runs a deficit and it rolls over a lot of old debt.   In fact the CBO has been projecting that the deficit will rise in the future (almost) solely due to the CBO’s projections that interest rates will rise.   But the CBO is only guessing about future interest rates and so far it has been overly pessimistic for several years.  Nobody can really predict future interest rates.

Anyhow, higher interest rates could be a good thing, depending on what causes them.  Interest rates would rise due to a rapidly growing economy which would raise government revenues and help the government pay off the debt.  The bad thing that could raise interest rates is a fear that the US government is going to default or otherwise renege on its debts (like in Greece), but I’m not worried about that because the markets are clearly signalling a strong faith in US government debt.  That is why government interest rates have been at historic lows.  And that is why interest payments are so low despite high total debts.

govt interest ratesI won’t start worrying about US government debt until interest payments start rising (as a percent of GDP) and/or until interest rates rise which could cause more trouble in the long run when the government refinances its debt at higher interest rates.  Fortunately, the doomsayers have been wrong about both since the Great Recession of 2008.  So far so good.


Posted in Macro, Public Finance

See page about The Positivist Fallacy

I wrote a new page about The Positivist Fallacy which explains why positivism is impossible and the whole normative-positive distinction is illogical and useless at best or may even be harmful at worst.  An example of how positivism has been harmful is the rise of mmutilitarianism which happened when positivists helped motivate economics to reject its utilitarian moral foundation in the 1930s and 40s. This marriage of positivism and economics created a mutated accidental lovechild, mmutilitarianism, which would be less harmful if economists recognized it as being the moral philosophy that it is.  When you analyze mmutilitarianism using some of the other tools of moral philosophy, it is easy to intentionally use the strengths of mmutilitarian heuristics and avoid some of the weaknesses.

Posted in Medianism, Philosophy and ethics

Enter your email address to follow this blog and receive notifications of new posts by email.

Join 75 other subscribers
Blog Archive
Pages