The Fed Hates Unemployed People

The Fed is the one institution in America that is specifically responsible for centrally planning our economy by controlling the supply of money, the price of money (interest rates), and the inflation rate.  Although the press and the textbooks commonly say that its “dual mandate” is to keep both inflation and unemployment low, its actual charter and mission statement is mostly about stabilizing bank profits and that is the job that it really takes seriously.  The Fed has never really cared about reducing unemployment unless it thinks that lowering unemployment would help bank profits… Until last December.  Then for the first time in history, the Fed announced that it would target lowering the unemployment rate!  But it soon started backpedaling.  The initial announcement on December 12 had a goal of lowering unemployment to 6.5%, but a little over a month later, the Fed scaled back its goal to 7%.  Immediately the stock market declined at what investors seemed to see as bad news for growth.  Recently, the Fed has announced further “tapering” of its goals and the results have been disastrous.  Brad Delong calls it, “The Largest and Most Rapid Contractionary Shift since 1981.”  The 1981 monetary contraction caused the steepest recession since the Great Depression.  Delong graphs what it is doing to real interest rates to illustrate the severity of the Fed’s actions:

Screenshot 7 10 13 11 30 AM

The Fed’s own plans say that it expects to fail at both of its “dual mandate” goals.  Despite its projected failure, the Fed announced that it is “tapering” its efforts to meet its own goals!  That is like a doctor who says that your treatment is too small to cure you so he will reduce the treatment and prolong your agony. That sort of planned failure would get you fired from most jobs, unless your real boss had another goal for you.  There is probably a lot of political (organizational) disfunction there, but some of that disfunction is caused by the fact that the Fed’s main (hidden-in-plain-sight) mandate is to do what the big banks want.

Tagged with:
Posted in Labor, Macro

Inheritance and Meritocracy

I have been reading Kaushik Basu’s Beyond the Invisible Hand: Groundwork for a New Economics lately.  Basu proposes that the world would be much better off with a much bigger inheritance tax because it would reduce persistent inequality.  It won’t solve the problems of poverty and inequality, but it would help.  Basu, who is originally from India, says it would reduce the de facto caste system that is present everywhere.  It is remarkable how the inheritance tax has declined during the same period that inequality has risen.

According to the New York Times, “Michael D. Hurd and James P. Smith of the RAND Corporation estimated that half of the children of parents born from 1931 to 1947 — that is, parents who are about 60 to 75 years old — would inherit less than $19,000, while the top 5 percent would receive at least $237,000.”  According to the Center on Budget and Policy Priorities (CBPP), “today, 99.86 percent of estates owe no estate tax.”  And because much of large estates is composed of long-term capital gains, a lot of wealth is evading any sort of taxation at all.   The CBPP explains many myths about the estate tax, but one reason that it is unpopular with regular folk is that they see it as a “death tax” rather than an estate tax.  Nobody wants to tax death, but wealthy estates are another matter.  Republican pollster Frank Luntz said that the term “death tax” “kindled voter resentment in a way that ‘inheritance tax’ and ‘estate tax’ do not”.  “Death tax” is a misnomer because there is almost zero correlation between death and the estate tax.  Only 1 in 714 deaths is currently correlated with the estate tax.   Extremely large estates are correlated with the estate tax, so perhaps a better name for it would be the large estate tax.

There are many arguments in favor of the estate tax, but one that relates to my recent posts is that the estate tax should encourage more investment in meritocracy and less expenditures on lavish consumption for heirs.  Currently, there is little point in investing in the human capital of heirs like Paris Hilton* who will never need to work and indeed, she did not graduate from high school.  But with a bigger inheritance tax, it becomes more imperative to invest in children to help them to enjoy future wealth and status rather than just giving them money.  Because wealthy elites have disproportionate ability to set social norms, if the scions of the wealthiest elites spent more time working and less time partying, some of that ethos is likely to trickle down to the frat pack of the merely well-off.

*An odd backstory about the inheritance within the Hilton family is that Paris’ great-grandfather, Conrad Hilton, had planned to leave 97% of his estate to charity, but his son Barron contested the will and got much of the fortune.  Thirty years later, around the time when Barron said he was embarrassed by Paris’ behavior, Barron said he would give 97% of his estate to charity, but we will see if Paris’ father follows family tradition and contests it when the time comes.  A higher estate tax would encourage even more charitable donations and make it less lucrative for heirs to subvert the will of the deceased.

UPDATE:  See “Death Tax” worse than an “Estate Tax”

Posted in Medianism

Bombing People For Freedom

Kaushik Basu says that the Vietnam War was ostensibly fought in the name of promoting democracy and freedom.  But official US war statistics don’t make it sound very free and democratic:

The Indochina War, centered in Vietnam, was the most intense episode of aerial bombing in human history: “the United States Air Force dropped in Indochina, from 1964 to August 15, 1973, a total of 6,162,000 tons of bombs and other ordnance. U.S. Navy and Marine Corps aircraft expended another 1,500,000 tons in Southeast Asia. This tonnage far exceeded that expended in World War II and in the Korean War. The U.S. Air Force consumed 2,150,000 tons of munitions in World War II – 1,613,000 tons in the European Theater and 537,000 tons in the Pacific Theater – and 454,000 tons in the Korean War” (Clodfelter 1995). Thus Vietnam War bombing represented at least three times as much (by weight) as both European and Pacific theater World War II bombing combined, and about thirteen times total tonnage in the Korean War. Given the prewar Vietnamese population of approximately 32 million, U.S. bombing translates into hundreds of kilograms of explosives per capita during the conflict.

Three times as many bombs as in WWII, but concentrated in an area that is half the size of Texas.  The median Vietnamese certainly didn’t want this kind of attack.  One way to assess claims that invading or bombing a nation is helping them is to use medianist measures.  Does polling suggest that they want to be bombed?  Does the bombing show economic benefits at the median?  It is hard to see any medianist benefit in Vietnam, so the US wasn’t fighting for their benefit, but for our own perceived benefit.  Medianism cannot improve much on the decisionmaking outcome in a case like the Vietnam war.  The median voter of the combined population might even be in favor of war if it is popular enough in the large country.  But if the median voter in a large powerful country wants to invade a smaller weaker country, there is nothing the weaker country can do about it anyhow.  The one place where medianism might help is in disillusioning the people of the powerful country from delusions of charitable war.  It gives a more concrete measure of benefit.  Unfortunately, it will probably be insufficient because people love to hold on to their delusions during wartime and in both Iraq and Vietnam, it should have been obvious that the war wasn’t helping the people.

Even mutilitarian measures show economic disaster in Vietnam which did not recover for 20 years:

vietnam real gdp per person

And Iraq still hasn’t recovered, but probably soon will:

iraq real gdp per person

Posted in Medianism

The Paradox Of Debt

There are various macroeconomic theories that claim recessions are caused by changes in debt.  These theories make intuitive sense.  For example, in Minsky‘s version, investors get overly speculative during periods of economic stability and take greater and greater risk in lending (investing) their money which fuels speculative financial bubbles.  When the bubbles pop, the investors stop lending their money and the debtors must pay it back.  This causes a balance-sheet recession in which most people have greater debts than assets (on their ‘balance sheet’) and so they must spend less to pay back their debts.  This is also sometimes known as the debt deflation theory of recession.  In the debt deflation theory of recession, people try to deflate (or reduce) their debts which causes price deflation as the aggregate demand for goods and services falls.

Similarly, as John Cassidy says in his book, How Markets Fail, the housing bubble was caused by an explosion of debt in the US.  From 2002 to 2006, total debt outstanding increased 42%!  “The increase in debt amounted to about $43,000 for every person in the country, including children and senior citizens.”  (p.223)  But that also means that someone else was lending that much money to the debtors, so the net debt did not change.

The paradox of debt is that net debt is always zero for a group in total. One person’s debt is always equal to another person’s asset.  So the total net debt of the world is always exactly zero.  The US can borrow money from foreigners, but net US foreign debt is fairly modest because Americans also lend a lot of money to foreigners.  Most US borrowers get their money from US lenders.  From this perspective, there can never be a general increase in debt.  It is always zero!  But then how do we get measurements like the following graph from Cassidy?

File:U.S. Public and Private Debt as a % of GDP.jpg

I have no idea!  Unfortunately, these kinds of graphs are rarely accompanied by a good explanation of what they are trying to measure.

The Fed’s flow of funds accounts shows the total amount of debt and the total amount of financial assets in the nation and they are approximately equal (plus the measurement error).  Here is their measure of financial assets:

financialassets

Which is almost exactly equal to their measure of debt:

debt

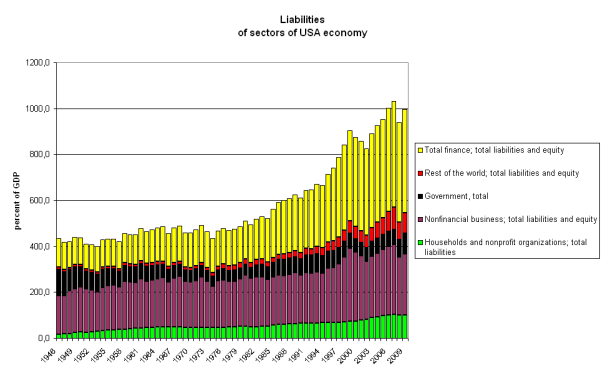
Finally, you can see in the top graph that the green bars representing the financial assets of households (& nonprofits like foundations and universities) is much larger than the green bars representing their debts in the second graph.  Subtracting assets from debts for each sector yields their net savings which is mainly owned by households and the following graph shows net savings equals net debts which are mostly owed by US businesses and government.

net_financial

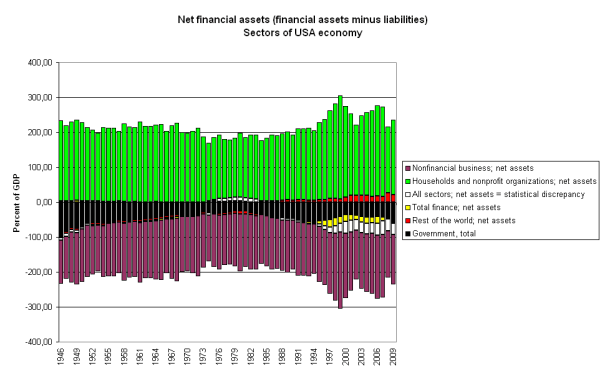
The yellow bars are the banks (and related financial firms) which normally have assets that almost exactly equal their debts, but which took on extra net debt in the 1990s which disappeared during the financial crisis in 2007.  At the same time, the white error bars expanded and have yet to shrink.  I’d love to learn how/why the banks took on a lot of excess debt in the 1990s and why the Fed’s flow of funds accounts developed a big, persistant measurement error during exactly the same period.

The only way there can be an increase in total debt (which Cassidy purports to show) is if we only focus on the debts of one particular group while ignoring the increased assets of the lenders.  But this is completely arbitrary.  If we want a better measure of debt we have to examine the distribution of assets and debts.  One possibility is to begin measuring median household net debt.  Because the wealthy are the primary net savers in every country, and the middle class is the primary borrower, the median net debt could be a much more useful macroeconomic indicator than the data in Cassidy’s graph which does nothing to explain 90% of the recessions that are shaded on the graph.

The standard Keynesian explanation for recessions is all about the distribution of financial resources.  A recession is caused by excess savings (or ‘hoardings‘) that aren’t being loaned out and spent.  Very few people near the median income and below have net savings at all, much less excess savings, but there are times when most people all try to save more (or payoff debt which is the same thing).  When everyone tries to increase savings at the same time, it must cause excess savings (or ‘hoardings’) which must cause a recession.

Every dollar saved represents a debt that someone else owes.  When someone gives you goods or services in exchange for your savings, they are paying society’s debt to you.  Although some savings is hoarded, most savings is loaned out again (as debt) to someone else.  Because savings are incredibly unequally distributed, that means that only a fairly small number of wealthy elites can have net financial savings.  Most people have net financial debts.  Many people also have physical assets (like housing or a share of a business) that could be sold to pay off their financial debts, but if we only look at the distribution of claims over financial assets rather than real assets, the vast majority of people in every society are financial debtors who owe a few wealthy elites.

Whereas everyone in the world could have an equal share of real assets like land, a financial asset is only created by creating debt and so financial assets can never be equally distributed.  Someone has to owe someone else.

A better measure of debt would explicitly address the distribution of debt.  Median debt/GDP is one such measure, but nobody will really know exactly how useful it is until we start collecting the data.  There has hardly been any attempt to measure the distribution of assets and liabilities for households. It could be important because, as Robert Schiller says, inequality leads to debt which could contribute to economic crisis:

A 2015 study published in The American Economic Review by Michael Kumhof of the Bank of England, Romain Rancière of the International Monetary Fund and Pablo Winant of the Bank of England found that both the Great Depression of the 1930s and the Great Recession of 2007-9 had their origins, in part, in rising inequality.

Both were accompanied by increases in borrowing by low- to middle-income people, who tried to maintain their standards of living. High-income people, described by the authors as desiring wealth for its own sake, did the lending.

That is just one study.  More research is needed.

Posted in Macro

Colleges Neglect The Needs of The Median

Yesterday I wrote that the US is moving towards a more Asian-style culture that is focused on manufacturing meritocracy, where elites are paying for more educational enrichment than the average American can afford.  However, it isn’t really clear to me if Americans are really paying more for education and human-capital development or if we are paying more for lavish amenities at quasi-educational institutions.  The data does not say how productive all that elite spending is.  Elizabeth Armstrong and Laura Hamilton’s new book, Paying for the Party: How College Maintains Inequality, indicates that much of the increased spending on higher education is really an increase in lavish consumption activity.  Colleges are becoming more like summer camp where fees have been rising even faster than tuition–74% in the past five years!  Many college students are going into massive debt to pay for four years of partying.  David Leonard and C. Richard King recently wrote:

At best, faculty members become a combination of cruise director, customer-service agent, and concierge, whose role on campus is to provide students with the most amount of fun. At worst, the faculty is an impediment and obstacle to the primary goal of parties, drinking, sports, theme weekends, and more parties.

So is inequality leading to more party schools and expensive summer camps or is it leading to greater pursuit of meritocracy among elites?  I think there is some of both dynamics going on and greater inequality drives both greater excessive consumption and greater ability to manufacture meritocracy.  That is why the higher education market has somewhat bifurcated into expensive party schools and elite academic institutions “where fun comes to die.”  Lower inequality should reduce excesses in both respects.  Colleges would not target the luxury-car segment of the population as much if that segment had less money and the median had more.  And there would be greater economies of scale in offering more modest amenities in targeting customers with incomes closer to the median.  And the elite schools that offer rigorous academics would get more students closer to the median income than they do now.  David Leonhardt found that elite schools enroll very few students from the bottom half of the income distribution.  For example:

I wouldn’t expect 50 percent of Harvard students — or even, say, 40 percent of Harvard students — to come from the bottom 50 percent of the income distribution. But 6.5 percent? To put it another way, do you believe that more than 93 percent of the students who are most deserving of attending the nation’s most prestigious, best financed college come from the top half of the income distribution?

Harvard has such a hard time getting low income students that they give need-based aid to families that earn $180,000 which is more than three times the median income.  At Harvard and many other elites schools, $180,000 is considered low income.  And one recent study found that richer students actually get more financial aid than poor students because richer students get so much merit scholarships!  The best way to reduce these perversities is to reduce inequality and promote policies that benefit the median more.

Posted in Labor

Manufacturing Meritocracy

I was recently talking with some wealthy parents and I was struck by how they are able to lavish private preschool education on their children that cost more than the $30,000 tuition at private colleges like Bluffton University and then add expensive enrichment activities like ice skating lessons and music lessons on top of that.   The inequality of educational opportunity in America is making our ‘meritocracy‘ less about merit and more about the privileges of being born into wealth.  The US is becoming more like the private educational system of two centuries ago when the elites hired private tutors like Adam Smith to teach their children while everyone else remained illiterate.

Asia has found a way to democratize this sort of private education by creating relatively inexpensive cram schools for the masses that teach groups of children after school.  In these societies the meritocratic ethos has trickled down to middle-income families who emulate the elites in paying for private tutors, and they have achieved economies of scale whereby large groups of kids attend private cram schools together.  Many Asian countries also have gender inequality which makes women’s wages cheap.  Asian women can become teachers and are de-facto excluded from most other occupations.  This cheap labor poor makes education cheap.  But richer families hire high-quality private tutors whereas middle-class families send their kids to crowded cram schools. When I lived in Taiwan, I was a private English tutor for rich kids and taught in elite cram schools.  One pair of kids required a Chinese tutor to help manage their unruly behavior while I tried to teach English.  The boy frequently made visceral screams in protest against his studies.  If he had been in a  middle-class cram school he would have been kicked out, but after a year of patient guidance and tutoring, he became a decent student and stopped writhing and moaning.

Inequality will always be crucial in determining the distribution of services because the cost of services goes up with the cost of labor.  Manufacturing has democratized the distribution of consumer goods.  Almost everyone can afford pens and paper and books today whereas a book used to cost as much as a small farm before Gutenberg.  But education will always be out of reach for many families with children.  in 2011 (latest data available), the median income for a US household with children was $57,240 and the median income for a single-parent household with children was about half that.   The average number of children per family is about 2 and poorer families tend to have more children in the US.  The average family will need to spend the average amount on primary and secondary school tuition (10,694 each in 2009) for two kids which is $21,388 for 12 years.  For single-parent families, that is most of their income, but even for the median American family, it is 37% of their income and it would push them down to only 50% above the poverty line.  Forget about saving for college which cost an average of $22,092 per year (including room and board) in 2011.    One of the reasons that college is so much much more expensive in the US than in other countries is our high inequality.  The average college student comes from a much richer family than the average family and so colleges have the incentive to target the average dollar (businesses have incentives to be mutilitarian) in determining their pricing structure and amenities.  Higher inequality makes colleges seek a richer average customer with higher average willingness-to-pay and produce a product that appeals to more luxurious tastes.  Education will never be affordable for everyone as long as it is a service that is produced by other people and even the median American will always find that it is a struggle to afford it.  That is an important reason why the median American cannot get a college degree.

Miles Corak (via Krugman) recently found that inequality in educational enrichment is increasing in American.  The wealthiest 20% is spending much more than than it did three decades ago, but the bottom 20% has not seen much gains.  This is because higher inequality makes educational enrichment more expensive for the bottom and suppresses their expenditures because inequality raises the average cost of services.  Inequality lowers the relative cost of services for the elites (servants are coming back into vogue among elites today), but raises the relative cost of services for the median and for people at the bottom.

American elites today have figured out how to manufacture human capital in their children.  This is a much better use of their money than the $10 million David Brooks spent on his daughters’ 13th birthday party, but it means that meritocracy today is more about inherited wealth than it is about inherent merit and character.   The slave societies of yesteryear were meritocratic too in that their elites really had greater skills and ability (merit) than their slaves, but that was simply because the slaves were barred from attaining the kind of ‘merit’ that would give them the ability to perform higher-paying jobs.  Meritocracy is always going to be partly about what kids inherit, but proponents of meritocracy should think more about how to increase equality of opportunity.  That is going to require reducing inequality in America because of the  Great Gatsby Curve.

File:The Great Gatsby Curve.png

There is a high correlation between equality now and the opportunities of children for their future (inter-generational mobility) because of the ability to manufacture opportunities for children.

Posted in Inequality, Labor

Distribution Matters

Kevin Drum gives a little statistical lesson about how thresholds have very different effects when they apply to the center or the tail of a statistical distribution.  In the case of violent criminals, a slight shift in the distribution has a dramatic effect on the tails, but for education, a slight shift has only a slight effect on the average.  Climate change could have a dramatic effect on the number of extreme weather events despite having only a small effect on the average temperature for the same reason.  Read his full post for more, but here is an excerpt that gets at the most salient concept.

…when you expose huge numbers of children to lead, as we did with leaded gasoline after World War II, what you’re essentially doing is moving the bell curve to the right. For most people, that makes very little difference. But for a few who were already on the edge, it pushes them over into a life of violent crime. And when you move a bell curve, the area under the rightward tail increases a lot. The diagram below illustrates this:

What this means is that a small effect from lead can have a very big effect on the level of violent crime. Crime rates will double or triple, and this makes it amenable to statistical study. Because crime has so many different causes, it’s still not easy to figure out what happened, but at least it’s possible.

Education is exactly the opposite. In this case, we’re dealing with big groups (nearly everyone graduates from high school) or averages (test scores, for example). Those move only slightly when the bell curve moves to the right:

You can see the problem. If, say, the average score on a test improves from 300 to 307 over the course of 20 years, it’s too small an effect to isolate. The same is true if graduation rates increase from 75 percent to 79 percent. There are dozens of things that could plausibly cause this, and figuring out a way tease out the individual contribution of lead is all but impossible.

I’m still thinking about how this could relate to changes in the income distribution.  Are there any threshold effects that cause large changes to a tail of the distribution as incomes rise or fall? These could be poorly measured by both the mean and the median, but because there is dimmeu, there might not be any effects at the top end of the income distribution that are important for human welfare.  But this does help illustrate why sales of luxury goods grow so fast when incomes at the top increase.

Tagged with:
Posted in Inequality, Labor

Enter your email address to follow this blog and receive notifications of new posts by email.

Join 75 other subscribers
Blog Archive
Pages